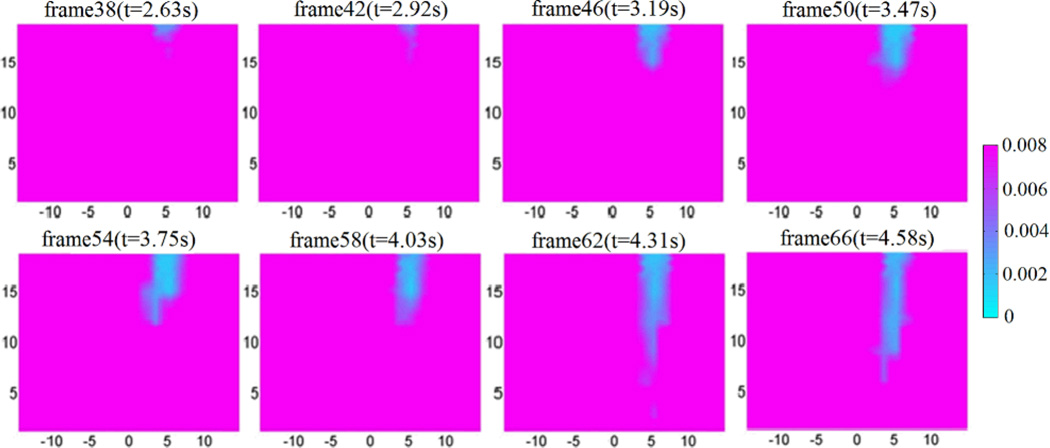
Figure. 11.
(Color online) Reconstructed 3-D absorption images from wavelength 780nm at different time points/frames when the fluids flow through a small tube. The images are shown at cut plane x = 10mm. The fluids flow from the top to the bottom at a speed of ~6mm/s, and the imaging sampling rate is ~14Hz. The color bar shows the absorption coefficient value (mm−1), while the axes indicate the spatial dimension (mm).

