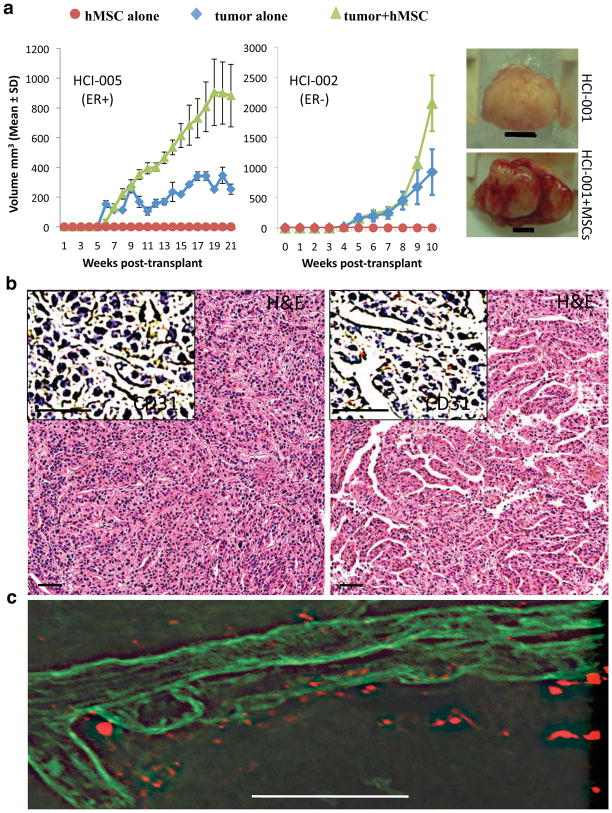
Figure 4. Co-engraftment of human mesenchymal stem cells (hMSCs) promotes vascularization and growth of tumor grafts.<.
br>a. Left and middle: Growth rates are shown for cohorts of tumor grafts (derived from either the ER+ tumor HCI-005 or the ER− tumor HCI-002) implanted either alone (blue diamonds), or with MSCs (green triangles). Mice injected with MSCs alone are indicated by red circles. Right: Photograph of representative tumors (derived from the ER− tumor HCI-001) grown with (bottom) or without (top) MSCs, isolated 59 days after transplantation. Tumors grown with MSCs were both bloodier and larger. Scale bar represents 5 millimeters. b. H&E staining, and antibody staining for CD31 (inset), identified elaborate vascular networks in tumor grafts in the presence of hMSCs (right panel) compared to the same tumor graft line growing in the absence of hMSCs (left panel). c. Confocal microscopy on thick frozen tumor graft sections showed that blood vessels (identified by lectin staining; green) are in close proximity to, but not comprised of hMSCs (identified by diI label; red).

