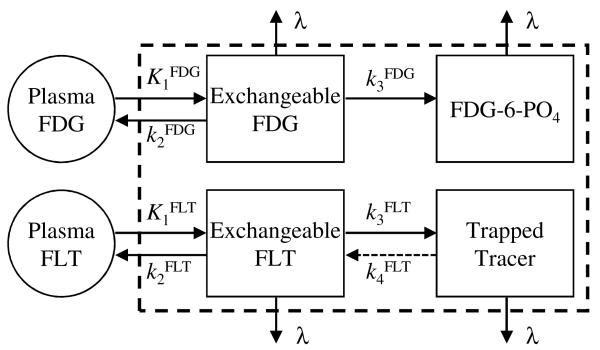
Figure 1.
Compartment models for FDG (top) and FLT (bottom), shown with the effects of radioactive decay (λ) included with the models. The dashed box represents parallel multi-tracer compartment modeling for temporally overlapping dual-tracer FDG+FLT time-activity curves. Here, the inputs for each tracer drive each model separately in the conventional sense, but the PET measurement comprises the sum of all tissue compartments including both tracers.

