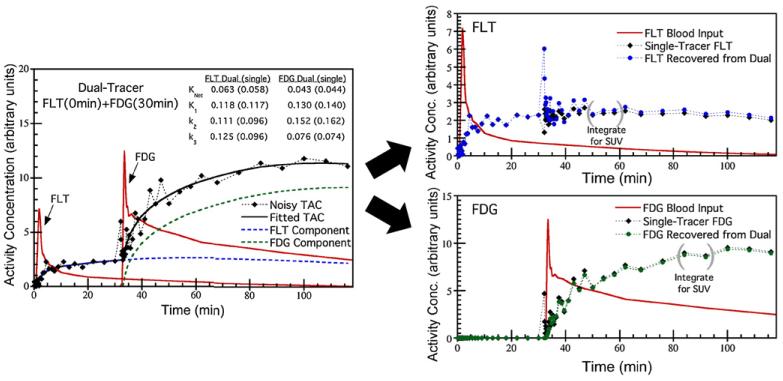
Figure 2.
Simulation study example showing a dual-tracer FLT(0 min)+FDG(30 min) time-activity curve and kinetic model fit (left), and recovered FLT and FDG components (right). The dual-tracer fit results are shown, along with the corresponding single-tracer fits in parenthesis. Using explicit signal separation, the noisy dual-tracer TAC is separated into estimated TACs for each individual tracer. Note the noise structure in the recovered TACs, especially in the FLT TAC around 30 min where short timeframes corresponding to the FDG injection result in high noise levels; these timeframes could be collapsed to long timeframes with lower noise in the recovered FLT TAC as desired. Static image values, e.g. SUVs, can be recovered for each tracer by integrating the recovered TACs as indicated.

