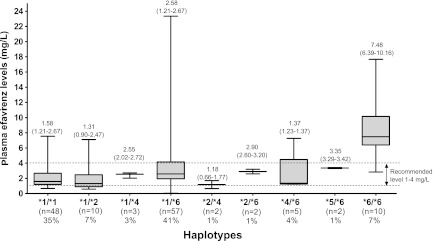
Fig 2.

Distributions of CYP2B6 haplotypes and plasma efavirenz concentrations at 12 h after dosing by haplotypes. The middle bar indicates the median, and the upper and lower bars indicate the 25th and 75th interquartile ranges. The medians and 25th and 75th interquartile ranges are displayed on each box.
