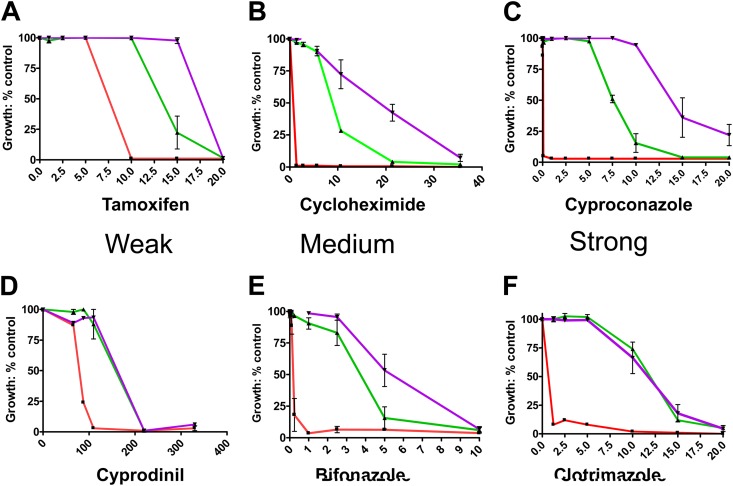
Fig 7.
Resistance of the V656L mutant to Pdr5 transport substrates. We show plots of growth versus substrate concentration for six of the 10 compounds tested. Conditions for testing substrates in liquid culture are found in Materials and Methods. These vary in their substrate strength. (A to C) Data from substrates ranging from weak (tamoxifen) to strong (cyproconazole), to which the V656L mutant (purple plots) confers increased resistance. Strength is determined by comparing the IC50s of the WT (green) and Δpdr5 mutant (red) plots. (D to F) Data from substrates ranging from weak (cyprodinil) to strong (clo) that cause significant (>50%) inhibition of ATPase activity (see Fig. 9). All concentrations are in μM units. n = 3.

