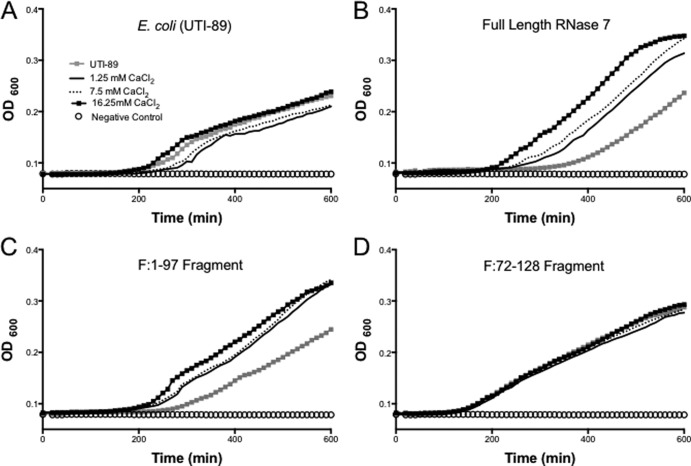
Fig 6.
E. coli growth curves after treatment with different recombinant peptides at various CaCl2 titers and with no added CaCl2 (gray squares). (A) E. coli showed similar growth under all conditions. (B) Full-length RNase 7 activity is inversely related to CaCl2 concentration. (C) F:1-97 has activity pattern comparable to full-length peptide at various CaCl2 concentrations. (D) F:72-128 has similar activity against E. coli at all CaCl2.

