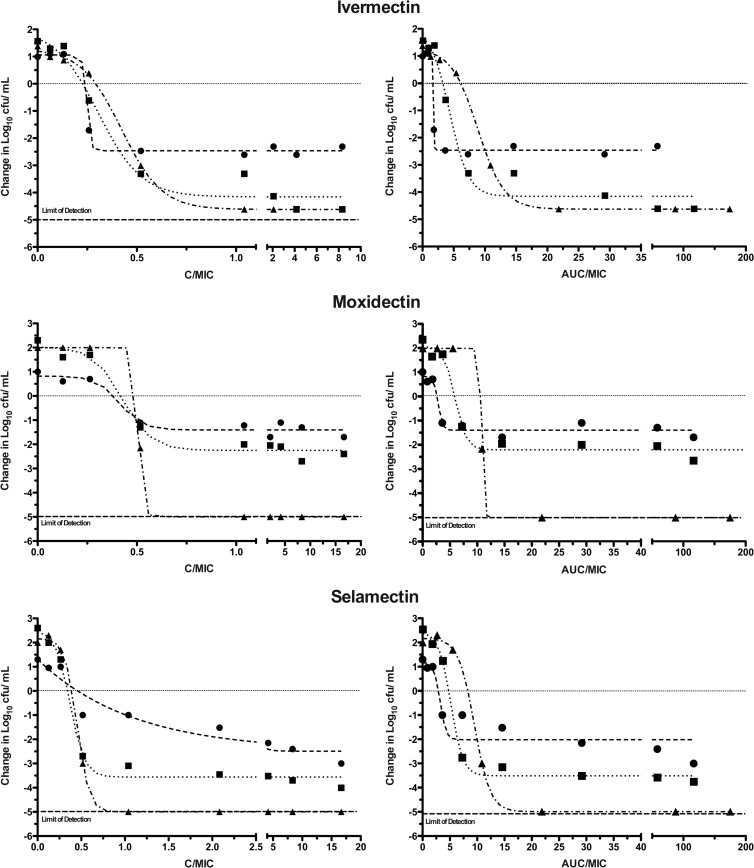
Fig 3.
Effect of concentration and exposure on the bactericidal activities of avermectins against M. tuberculosis. Comparison of concentration and area under the curve over MIC ratios (C/MIC and AUC/MIC, respectively) on the bactericidal activities of the avermectins. The bactericidal effect was calculated on the basis of the initial inoculum prior to the addition of avermectins. Analysis of antimycobacterial activity was performed by comparing the rates of bacterial killing determined by nonlinear regression analysis with 95% confidence limits. The r2 values on days 7 (filled circles), 14 (filled squares), and 21 (filled triangles) were 0.9959, 0.9766, and 0.9989 for ivermectin, 0.9591, 0.9827, and not available for moxidectin, and 0.88, 0.9949, and 0.9992 for selamectin, respectively. Cells were processed as described in the Fig. 2 legend for panel B but grown at 37°C in shaking 96-well plates containing 2-fold serial drug dilutions. The MIC values used for calculations were 6, 3, and 3 μg/ml for ivermectin, moxidectin, and selamectin, respectively, as calculated by the MTT assay.

