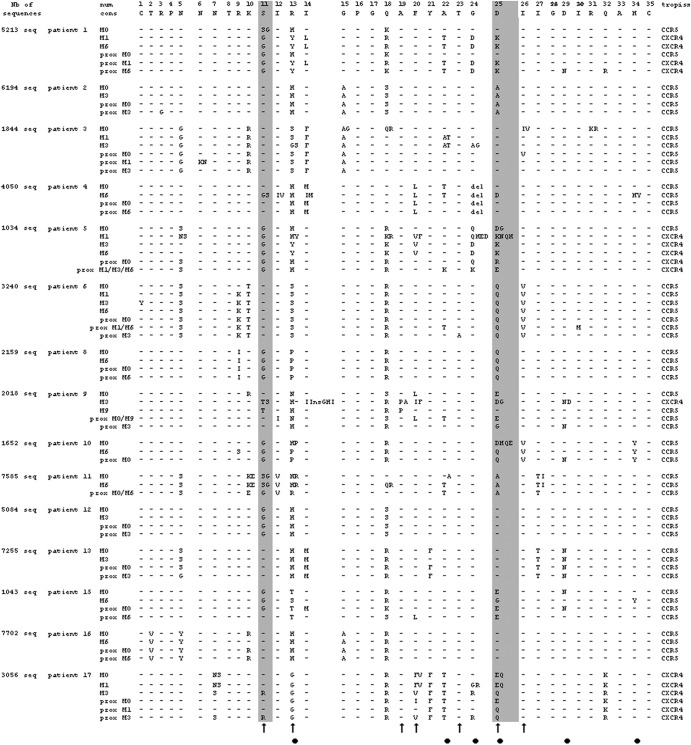
Fig 2.
Virological evolution of the V3 region in the patients failing on MVC. The number of 454 sequences used for the analysis is determined in the first column. Prox M indicated the 454 sequence found to be the most closely related to the bulk population sequence at the studied time. For patient 10, no proximal sequence was identified to M6 bulk sequence. No 454 data were available for patients 7 and 14. Columns for amino acids at positions 11 and 25 are in gray. Black arrows indicate positions of known mutations. Black circles indicate positions of mutations observed in this study.

