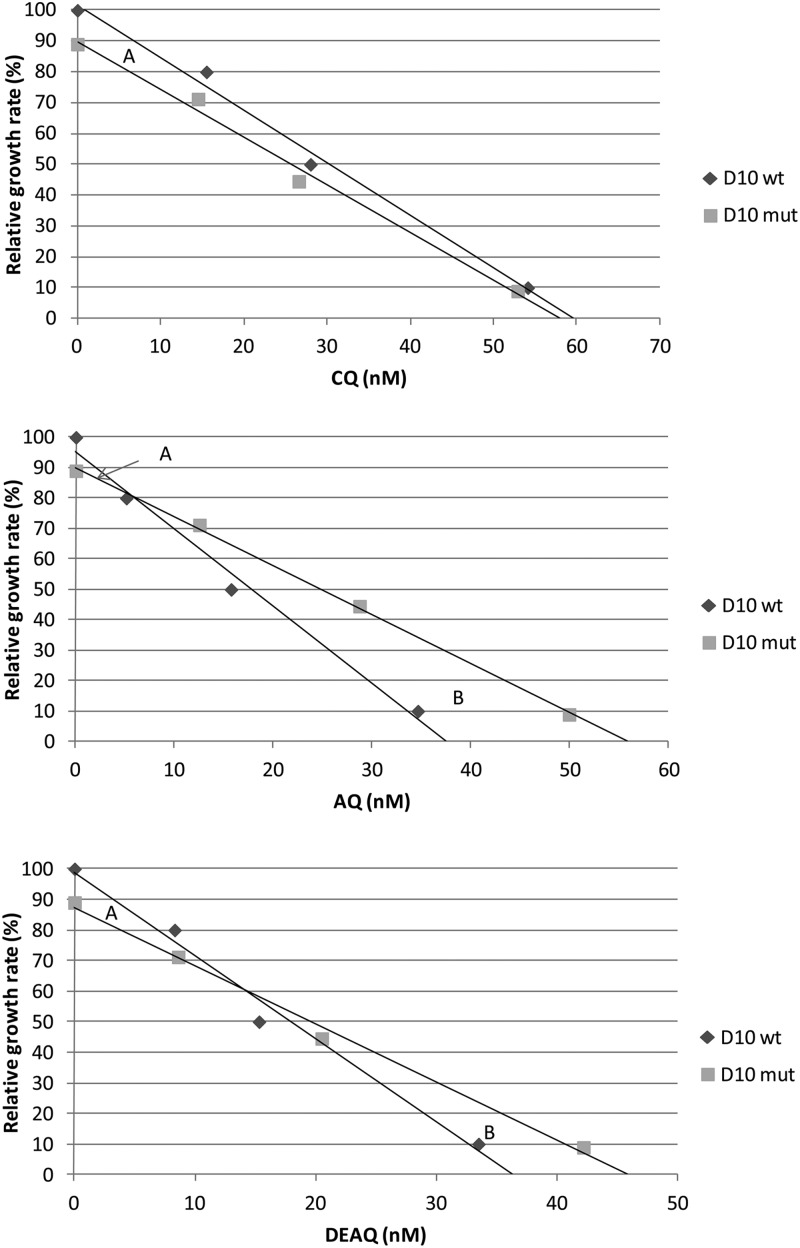
Fig 2.
Relative growth rates (%) of D10mut versus D10wt at different concentrations of CQ, AQ, and DEAQ (nM). The maximum growth rate for D10mut without drug exposure was based on the relative fitness (w = 0.89). The other plots are based on the IC20, IC50, and IC90 values. The trend line intercept indicates the breakpoint where the drug resistance benefit equals the fitness cost of pfmdr1 1246Y. Area A represents the fitness cost, and area B represents the drug resistance benefit of pfmdr1 1246Y over the full concentration range.

