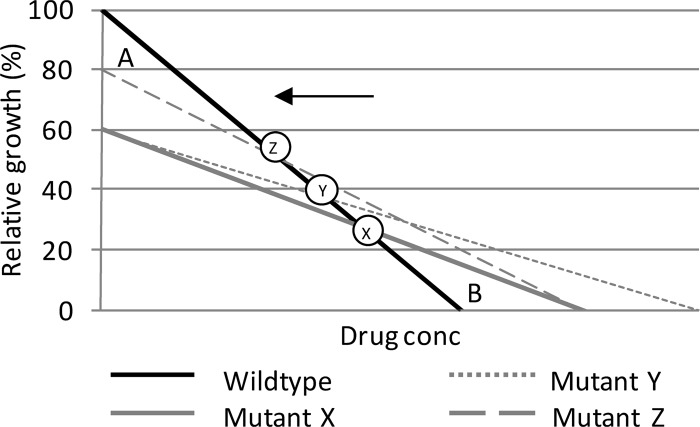
Fig 4.
Hypothetical graph of relative growth of a wild-type clone compared with that of a mutant clone (mutant X). The breakpoint concentration (X to Z) moves toward lower concentrations with the addition of synergistic mutations resulting in an increased resistance benefit (mutant Y) and/or compensating mutations resulting in a decreased fitness cost (mutant Z).

