Abstract
Rapid and efficient detection of viral infection is crucial for the prevention of disease spread during an outbreak and for timely clinical management. In this paper, the utility of Tat peptide-modified molecular beacons (MBs) as a rapid diagnostic tool for the detection of virus-infected cells was demonstrated. The rapid intracellular delivery mediated by the Tat peptide enabled the detection of infected cells within 30 s, reaching saturation in signal in 30 min. This rapid detection scheme was coupled with flow cytometry (FC), resulting in an automated, high-throughput method for the identification of virus-infected cells. Because of the 2-order-of-magnitude difference in fluorescence intensity between infected and uninfected cells, as few as 1% infected cells could be detected. Because of its speed and sensitivity, this approach may be adapted for the practical diagnosis of multiple viral infections.
INTRODUCTION
Testing for viral infection in a clinical setting is of extreme importance for identifying the appropriate treatment. In addition, a rapid method to identify the presence of viral infection is also of paramount importance for the military because of the potential threat of biological warfare agents. Since the efficacy of most antiviral drugs is the greatest when administered within 48 h of infection (1), rapid diagnosis allows a more timely application of these medications. This could have a direct implication in decreasing the potential of disease dissemination, mortality, cost, and the overall response time (2).
Traditionally, viral infection has been identified using cell culture, antibody binding to viral antigens, and/or amplification of the viral genome by PCR. Cell culture for viral propagation takes days before positive identification—if the virus grows in culture at all. PCR-based methods are substantially faster, but the requirements of DNA/RNA extraction and inhibitor removal before amplification usually require 3 to 4 h of analysis time (3). Direct antigen detection in infected cells by immunofluorescence is perhaps the fastest method but still requires incubation with labeled antibodies and washing before detection of an optical signal (4).
The development of improved molecular methods for rapid and quantitative detection of infectious viruses has received increased attention in recent years. The use of molecular beacons (MBs) that are single-stranded, fluorescently labeled oligonucleotide probes with a stem-loop structure is of particular interest as they offer the capability for in vitro and in vivo detection of a cDNA/RNA target based on the spontaneous increase in fluorescence (5–8). Molecular beacons have been employed for various applications, such as in vitro hybridization assays (9–11), RNA imaging (12), and real-time detection of DNA-RNA hybridization in living cells (13). Although MBs have been commonly used for intracellular detection of gene expression, their application for the in vivo detection of viral RNA have only been reported recently (14). The use of nuclease-resistant MBs enables the real-time detection of viral replication in living cells via Tat peptide delivery (15). Due to the exquisite sensitivity of MB to detect even 15 copies of mRNA per cell (13), cells infected as early as 15 min can be detected using this method.
Because of the rapid intracellular delivery, one logical extension of the MB technology is to explore its potential as a diagnostic tool for the detection of virus-infected cells. Even though fluorescence microscopy can be used for detection, this procedure is tedious and is not amenable to automation. To achieve automated, high-throughput sample processing, the use of flow cytometry (FC) is ideal, as it offers the capability of both quantitative and parallel sample analyses. Although flow cytometry has been used to detect different types of viruses (16–20), most reported methods are laborious, since they involve multiple cell fixation, permeabilization, labeling, and washing steps. In this paper, we report a simple and separation-free detection scheme for infected cells that requires no pretreatment by using Tat peptide-delivered MBs. Poliovirus (PV) was used as a model virus to demonstrate this new process.
MATERIALS AND METHODS
BGMK cell culture.
Buffalo green monkey kidney (BGMK) cells were cultured in autoclavable Eagle's minimal essential medium (AMEM) with Earle's salts (Irvine Scientific, Santa Ana, CA) containing 0.075% NaHCO3, 10 mM nonessential amino acids (NEAA; Gibco BRL, Grand Island, NY), 2 mM l-glutamine (HyClone, Logan, UT), 20 mM HEPES (pH 7.4), 100 mg/ml penicillin, 100 U/ml streptomycin (HyClone), and 8% (vol/vol) fetal bovine serum (FBS; HyClone). Cells were grown in an incubator maintained at 37°C and 5% (vol/vol) CO2. Phosphate-buffered saline solution (PBS; 0.01 M phosphate, pH 7.4, 0.138 M Na Cl, and 2.7 mM KCl) and Tris-buffered saline solution (TBSS; 0.05 M Tris, pH 7.4, 0.28 M NaCl, 10 mM KCl, and 0.82 mM Na2HPO4) were used during the washing steps for BGMK cell culture.
Virus preparation.
Poliovirus type 1 (PV1) (strain LSc) was obtained from American Type Culture Collection (ATCC VR-59) and propagated in BGMK cells for up to 5 days at 37°C. The virus stock was harvested and purified by using the freeze-thaw method and extracting the cell lysate with chloroform (21). The fresh virus stock was stored as 500-μl aliquots at −80°C until use.
Plaque assay.
The PV1 virus stock was thawed, and then a series of 10-fold serial dilutions in 1× PBS was prepared. BGMK cells that were 90% confluent and 1 day old and grown in 12-well, 22.1-mm dishes (Costar; Corning) were infected with 1 ml of virus dilution. After 90 min of adsorption at room temperature, the solutions were aspirated and 1 ml of 2% carboxymethylcellulose (CMC) sodium salt (Sigma-Aldrich) containing 100 ml of 2× AMEM (Irvine Scientific) with 2 ml of 7.5% NaHCO3, 4 ml of 1 M HEPES, 2 ml of NEAA, 5 ml of A/B-L (1,000 U/ml penicillin, 1,000 U/ml streptomycin, 2 mg/ml kanamycin, 2,000 U/ml nystatin, 80 mM l-glutamine), and 4 ml of FBS (Sigma-Aldrich) was added to each well. After 5 days of incubation at 37°C, the CMC layer was removed and the cells were stained and fixed with 0.8% crystal violet and 3.7% formaldehyde solution for 2 h. The excess stain was removed by washing with deionized water, and virus plaques were counted to calculate the titer of the stock.
Molecular beacon design.
The MB-PV1 was configured from the sequences of poliovirus strains obtained from the GenBank database. To study the thermodynamic properties and predict secondary structures of the MB, a DNA folding program, mfold (www.bioinfo.rpi.edu), was used. The molecular beacon (MB-PV1) (5′-6FAM–CGAGCGCCCAAAGTAGTCGGTTCCGCC/thiol-DG/GCTCG-Dabcyl-3′) [underlining shows sequence complimentary to the poliovirus RNA; 6FAM, 6-carboxyfluorescein; Dabcyl, 4-(4-dimethylaminophenyl) diazenylbenzoic acid] was designed to be perfectly complementary to a 20-bp region of the 5′ noncoding region of the poliovirus genome. A 2′-O-methylribonucleotide backbone with phosphorothioate internucleotide linkages was incorporated into the beacon's structure during synthesis by TIB Molbiol. The thiol group near the 3′ end of the beacon is for conjugation with a maleimide group attached to the C terminus of the Tat peptide to form a thiol-maleimide linkage. The MB-PV1 was solubilized in 100 mM Tris-HCl (pH 8.0) buffer containing 1 mM MgCl2 to make a stock concentration of 100 μM and stored at −20°C as 50-μl aliquots until use.
Peptide design.
The C-terminally maleimide-modified Tat peptide Tyr-Gly-Arg-Lys-Lys-Arg-Arg-Gln-Arg-Arg-Arg-N-CH2CH2-N-maleimide (Global Peptide) was mixed with MB-PV1 in a molar ratio of 1:1.5. The reaction was allowed to occur at room temperature in the dark for 2 h to form a stable thiol-maleimide bond. The Tat peptide conjugated with MB-PV1 (MB-PV1-Tat) was aliquoted and stored at −20°C for experimental use.
Infection of BGMK with PV1.
BGMK cells were grown in 8-well Lab-Tek Chamber slides (Thermo Scientific-Nunc) at 37°C in 5% CO2 (vol/vol) until 90% confluent. After aspirating the incubation medium, the cell monolayer was washed twice with 1× phosphate-buffered saline solution (PBS) and incubated with different concentrations of PV1. The virus was allowed to adsorb to the cell surface for 30 min at 37°C, then the unbound virus particles were removed. The infection was allowed to proceed for 18 h.
Delivery of Tat-conjugated MBs into infected cells.
After 18 h of infection, the incubation medium in the PV1-infected BGMK cell culture was removed and replaced with 1× Leibovitz L-15 medium (Invitrogen). The Leibovitz L-15 medium contains no phenol red and is a CO2-independent medium, making it suitable for performing experiments using the fluorescence microscope. MB-PV1-Tat (2 μM) was slowly added to the infected cells and incubated at 37°C in the dark for 30 min prior to imaging and flow cytometry analysis.
Flow cytometry analysis.
After incubation, the medium was aspirated from the cell monolayer and replaced with 0.1% trypsin in 0.05% EDTA (Gibco) to detach the cells. A solution containing 10% FBS in 1× Tris-buffered saline (TBS) was added to the detached cells to neutralize the trypsin. Cells were harvested using a low-speed centrifuge at 1,500 rpm for 5 min. They were resuspended in 1× TBS containing 3 mM EDTA (pH 8.0) to avoid aggregation. A portion of the sample was aliquoted to observe under the microscope, while the rest was used for flow cytometry analysis. Cells were sieved using a 35-μm nylon mesh cell strainer (BD Biosciences) prior to flow cytometry analysis. The cells were analyzed using the BD FACSAria cell sorting system using a 407-nm UV laser for GFP excitation; the emission filter for detection was 520/20 nm. Data acquisition (105 events per sample) and analysis were performed using BD FACSDiva software.
Fluorescence microscopy and image processing.
A Zeiss Axiovert 40 CFL inverted microscope supplied with an HBO 50 W/AC mercury lamp (for fluorescence) and a 12-V, 35-W halogen lamp was used to perform live-cell imaging. For each sample well, both phase contrast and fluorescence pictures were taken. Image acquisition and processing was carried out using the Image-Pro analysis software (Media Cybernetics). All settings for image capture were kept consistent, and the exposure time for each sample was maintained throughout the course of the experiment.
Enumeration of fluorescent cells.
To calculate the percentage of fluorescent cells, multiple phase contrast images of each well were taken to count the total number of cells. Simultaneously, the number of fluorescent cells was counted within those frames using the Image-Pro PLUS analysis software.
RESULTS AND DISCUSSION
Rapid detection of PV1-infected cells.
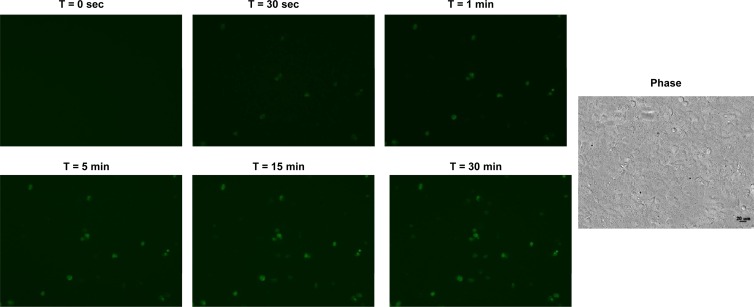
Rapid detection of virus-infected cells is crucial in a clinical setting since the efficacy of most drugs is the highest when administered within 48 h of infection. Although the ability of the Tat-modified MBs for real-time tracking of virus replication has been demonstrated, it is important to investigate whether the time scale of intracellular delivery and hybridization is also suitable for rapid diagnosis. To address this question, we performed an experiment in which BGMK cells were infected with a low dose (0.0001 PFU/cell) of PV1 for 18 h. This longer infection time was chosen to obtain samples representing cells from the very early stages of infection to highly infected cells. The infected cell suspension was mixed with 1 μM Tat-modified MBs and immediately monitored in real time using a fluorescence microscope. Fluorescent images were acquired every 5 s for 30 min in a fixed area of exposure. Figure 1 shows the fluorescence images at 6 different time points. Several fluorescent cells began to appear as early as 30 s, and the fluorescence intensity within those cells increased with time up to 15 min. This indicates that MB internalization occurred rapidly within a few seconds and that highly infected cells that have an abundance of the target viral RNA can fluoresce immediately upon MB uptake. The gradual increase in fluorescence intensity is consistent with the continuous MB internalization and hybridization to the target viral RNA with time. The number of fluorescent cells also continued to increase with time, reaching saturation at 30 min. The slight time delay observed in some cells may be a result of the different stages of infection or slightly different time scales for MB uptake. Collectively, this result suggests that 30 min of incubation is sufficient to distinguish highly infected from uninfected cells using the Tat-modified MBs based on fluorescence microscopy.
Fig 1.
Real-time detection of PV1 in BGMK cells. Cells were infected with 10 PFU PV1 for 18 h, detached and incubated with 1 μM MB-PV1, and monitored in real time from 0 to 30 min using a fluorescence microscope. The corresponding phase contrast picture is shown.
Detection of PV1-infected cells by flow cytometry.
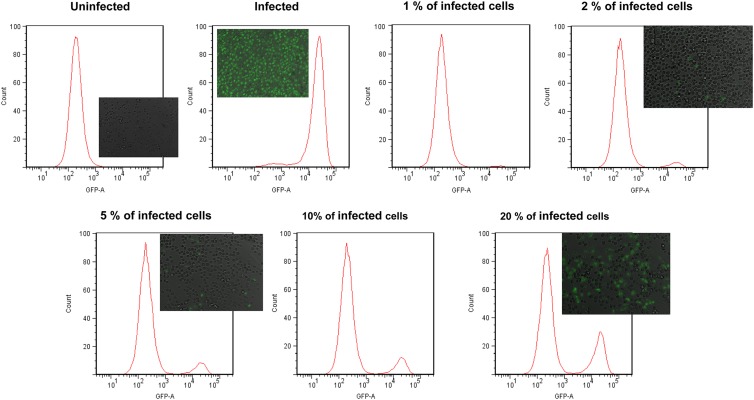
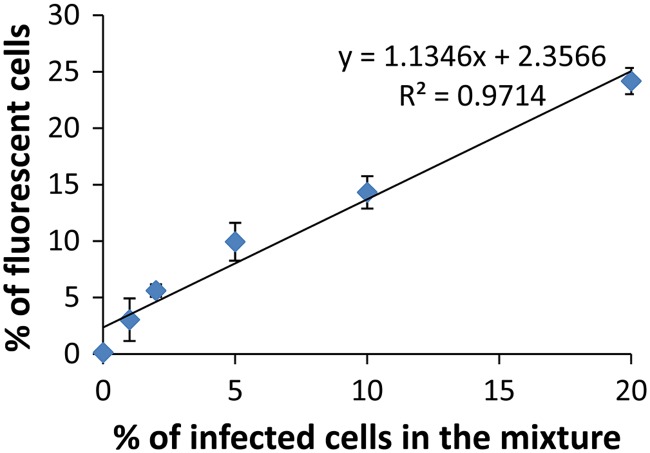
To evaluate whether FC could be used to rapidly quantify the number of infected cells in a sample composed of a mixture of infected and uninfected cells using the Tat-modified MBs, BGMK cells were first infected with a high dosage (106 PFU) of PV1 for 18 h. Infected cells were detached using trypsin and mixed with different amounts of uninfected cells to mimic different percentages of infection (1%, 2%, 5%, 10%, 25%, and 100%). After incubating with 1 μM Tat-modified MB for 1 h, cells were analyzed using a flow cytometer. Cells were gated according to their size and granularity so as to include only intact cells. Figure 2 shows the representative histograms from the flow cytometry (FC) analysis. A strong fluorescence peak was detected for the infected cells because of the spontaneous hybridization of the MBs with the target viral RNA; the average fluorescence intensity was roughly 2 orders of magnitude higher than that observed for the uninfected cells, indicating the absence of any false-positive signal. The number of fluorescent cells increased when an increasing percentage of infected cells was mixed with uninfected cells. A linear correlation between the percentage of fluorescent cells measured by flow cytometry and the percentage of infected cells in the mixture (Fig. 3) was detected. This result validates that the detection of fluorescent cells by FC was a result of hybridization between the MB and the target viral RNA. This result demonstrates conclusively that the MB-FC assay can be used to distinguish infected cells from uninfected cells based on the changes in fluorescence. Furthermore, the sensitivity of the assay was demonstrated, as it was able to measure less than 1% infected cells in a population of infected and uninfected cells.
Fig 2.
Quantification of PV1-infected BGMK cells using flow cytometry. Confluent monolayers of BGMK cells (1.5 × 10⁵ cells) in 8-well chamber slides were infected with 106 PFU of PV1. After 18 h of infection, cells were detached from the monolayer by using trypsin and mixed with uninfected cells to represent different percentages of infection (0%, 1%, 2%, 5%, 10%, 20%, and 100%). Cells were washed with 10% FBS followed by 1× TBS with 3 mM EDTA (pH 8.0), mixed with 1 μM MB-PV1, and subjected to flow cytometry. The corresponding fluorescence images for selected samples are included.
Fig 3.
The correlation between the percentage of fluorescent cells measured by FC and the percentage of infected cells in the mixture. Data shown are the mean values (± standard deviations) obtained from 3 independent experiments.
To further confirm the FC-based assay, selected samples were analyzed using conventional fluorescence microscopy (See insets in Fig. 2). The percentage of fluorescent cells was calculated by counting the total number of BGMK cells in the DIC image and the corresponding fluorescent cells in the same image. In Fig. 4, a direct comparison between the percentage of fluorescent cells measured from the FC assay and the fluorescence microscope is shown. A linear relationship was observed between the two assays, indicating that the FC-based assay can accurately detect and quantify the individual fluorescent cells in the sample. While the fluorescence microscope-based assay is useful for a qualitative understanding of the system and for visualizing virus-infected cells, the FC-based assay provides a high-throughput and rapid flow-based detection system.
Fig 4.
Comparison of fluorescent cell detection by FC and fluorescence microscopy. Various percentages of PV1-infected cells (0%, 1%, 2%, 5%, 10%, 20%, and 100%) were incubated with 1 μM MB and analyzed using either flow cytometry or fluorescence microscopy. The fluorescent and differential interference contrast (DIC) images from 5 different fields within the chamber well were captured using ×20 magnification, and the percentage of fluorescent cells was calculated. Data shown are the mean values (± standard deviations) obtained from 3 independent experiments.
Quantification of cells infected with different PV1 dosages.
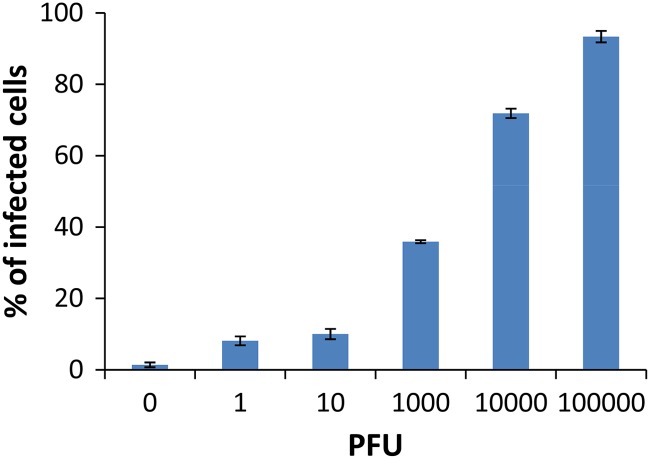
To further validate the utility of the FC assay for the detection of real infected samples, BGMK cells were infected with various dosages of PV1 from 0 PFU to 105 PFU (or a multiplicity of infection [MOI] from 0 to 1 PFU/cell). After 18 h of infection, cells were detached from the monolayer using trypsin and incubated with 1 μM Tat-modified MBs for 30 min. Samples were analyzed by FC as described above. As expected, there was a dose-dependent increase in the percentage of fluorescent cells detected (Fig. 5), and fluorescent signals were observed from cells infected even with 1 PFU of PV1 (Fig. 5). These results demonstrate the potential of the MB-FC-based method for the direct detection of cells infected even with a very low viral dosage.
Fig 5.
Quantification of PV1-infected cells using flow cytometry. Confluent monolayers of BGMK cells were infected with various doses of PV1 from 0 PFU to 105 PFU for 18 h. The percentages of infected cells shown in the graph were determined by counting the number of fluorescent cells and dividing it by the total number of cells counted.
Conclusion.
In this paper, a new FC-based MB assay was developed as a sensitive diagnostic tool for the rapid and separation-free detection of virus-infected cells. The use of TAT-modified MBs enables the real-time detection of viral RNAs in infected cells using any sample processing. We envision that this technique will be useful for the clinical detection of cells infected with epidemiologically important viruses, such as influenza virus. The ability of the beacon to recognize even a single-nucleotide mismatch is highly promising to differentiate between subtypes of influenza viruses that possess a fairly conserved genome. By exploiting the specificity of MB to differentiate between different subtypes of viruses, the reported FC assay may even be adapted for the diagnosis of multiple viral infections.
ACKNOWLEDGMENTS
This work was supported by EPA (grant RD83300801) and NSF (grant CBET1129012).
Footnotes
Published ahead of print 16 November 2012
REFERENCES
- 1. Charles PGP, Grayson ML. 2007. Point-of-care tests for lower respiratory tract infections. Med. J. Aust. 187:36–39 [DOI] [PubMed] [Google Scholar]
- 2. Aslanzadeh J, Zheng X, Li H, Tetreault J, Ratkiewicz I, Meng S, Hamilton P, Tang Y-W. 2008. Prospective evaluation of rapid antigen tests for diagnosis of respiratory syncytial virus and human metapneumovirus infections. J. Clin. Microbiol. 46:1682–1685 [DOI] [PMC free article] [PubMed] [Google Scholar]
- 3. Fouchier RAM, Bestebroer TM, Herfst S, Kemp LVD, Rimmelzwaan GF, Osterhaus ADME. 2000. Detection of influenza A viruses from different species by PCR amplification of conserved sequences in the matrix gene. J. Clin. Microbiol. 38:4096–4101 [DOI] [PMC free article] [PubMed] [Google Scholar]
- 4. Rabenau HF, Kessler HH, Kortenbusch M, Steinhorst A, Raggamb RB, Berger A. 2007. Verification and validation of diagnostic laboratory tests in clinical virology. J. Clin. Virol. 40:93–98 [DOI] [PubMed] [Google Scholar]
- 5. Marras SAE, Kramer FR, Tyagi S. 1999. Multiplex detection of single-nucleotide variations using molecular beacons. Genet. Anal. 14:151–156 [DOI] [PubMed] [Google Scholar]
- 6. Tyagi S, Alsmadi O. 2004. Imaging native β-actin mRNA in motile fibroblasts. Biophys. J. 87:4153–4162 [DOI] [PMC free article] [PubMed] [Google Scholar]
- 7. Tyagi S, Bratu DP, Kramer FR. 1998. Multicolor molecular beacons for allele discrimination. Nat. Biotechnol. 16:49–53 [DOI] [PubMed] [Google Scholar]
- 8. Tyagi S, Kramer FR. 1996. Molecular beacons: probes that fluoresce upon hybridization. Nat. Biotechnol. 14:303–308 [DOI] [PubMed] [Google Scholar]
- 9. Drake TJ, Tan W. 2004. Molecular beacon DNA probes and their bioanalytical applications. Appl. Spectrosc. 58:269–280 [DOI] [PubMed] [Google Scholar]
- 10. Fang X, Li JJ, Perlette J, Tan W, Wang K. 2000. Molecular beacons: novel fluorescent probes. Anal. Chem. 72:747A–753A [DOI] [PubMed] [Google Scholar]
- 11. Goel G, Kumar A, Puniya AK, Chen W, Singh K. 2005. Molecular beacon: a multitask probe. J. Appl. Microbiol. 99:435–442 [DOI] [PubMed] [Google Scholar]
- 12. Santangelo PJ. 2010. Molecular beacons and related probes for intracellular RNA imaging. Wiley Interdiscip. Rev. Nanomed. Nanobiotechnol. 2:11–19 [DOI] [PubMed] [Google Scholar]
- 13. Sokol DL, Zhang X, Lu P, Gerwirtz AM. 1998. Real time detection of DNA-RNA hybridization in living cells. Proc. Natl. Acad. Sci. U. S. A. 95:11538–11543 [DOI] [PMC free article] [PubMed] [Google Scholar]
- 14. Yeh HY, Hwang YC, Yates MV, Mulchandani A, Chen W. 2008. Detection of hepatitis A virus using a combined cell culture-molecular beacon assay. Appl. Environ. Microbiol. 74:2239–2243 [DOI] [PMC free article] [PubMed] [Google Scholar]
- 15. Yeh HY, Yates MV, Mulchandani A, Chen W. 2008. Visualizing the dynamics of viral replication in living cells via Tat peptide delivery of nuclease-resistant molecular beacons. Proc. Natl. Acad. Sci. U. S. A. 105:17522–17525 [DOI] [PMC free article] [PubMed] [Google Scholar]
- 16. Bordignon J, Ferreira SCP, Caporale GMM, Carrieri ML, Kotait I, Lima HC, Zanetti CR. 2002. Flow cytometry assay for intracellular rabies virus detection. J. Virol. Methods 105:181–186 [DOI] [PubMed] [Google Scholar]
- 17. Cantera JL, Chen W, Yates MV. 2010. Detection of infective poliovirus by a simple, rapid, and sensitive flow cytometry method based on fluorescence resonance energy transfer technology. Appl. Environ. Microbiol. 76:584–588 [DOI] [PMC free article] [PubMed] [Google Scholar]
- 18. Defoort JP, Martin M, Casano B, Prato S, Camilla C, Fert V. 2000. Simultaneous detection of multiplex-amplified human immunodeficiency virus type 1 RNA, hepatitis C virus RNA, and hepatitis B virus DNA using flow cytometer microsphere based hybridization assay. J. Clin. Microbiol. 38:1066–1071 [DOI] [PMC free article] [PubMed] [Google Scholar]
- 19. Kao CL, Wu MC, Chiu YH, Lin JL, Wu YC, Yueh YY, Chen LK, Shaio MF, King CC. 2001. Flow cytometry compared with indirect immunofluorescence for rapid detection of dengue virus type 1 after amplification in tissue culture. J. Clin. Microbiol. 39:3672–3677 [DOI] [PMC free article] [PubMed] [Google Scholar]
- 20. Lambeth CR, White LJ, Johnston RE, de Silva AM. 2005. Flow cytometry-based assay for titrating dengue virus. J. Clin. Microbiol. 43:3267–3272 [DOI] [PMC free article] [PubMed] [Google Scholar]
- 21. de la Torre JC, Wimmer E, Holland JJ. 1990. Very high frequency of reversion to guanidine resistance in clonal pools of guanidine-dependent type 1 poliovirus. J. Virol. 64:664–671 [DOI] [PMC free article] [PubMed] [Google Scholar]


