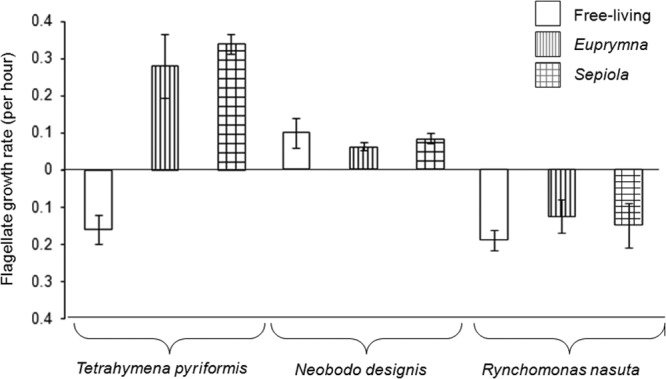
Fig 2.

Protozoan growth rates after grazing on early and late biofilms. Negative numbers represent mortality, and positive numbers represent growth. Different bar patterns represent different groups of V. fischeri isolates (free-living or symbiotic with Euprymna or Sepiola). Errors bars are the standard deviations for each treatment. Each protozoan group was significantly different from the others (P < 0.05), and within the Tetrahymena group there was a significant difference in growth rate when free-living strains were grazed (P < 0.05).
