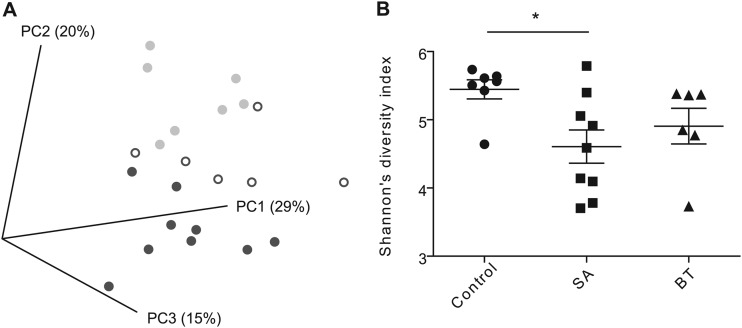
Fig 1.
Alpha and beta diversity measurements of the fecal bacterial communities. (A) Principal coordinate analysis based on UniFrac distances, segregated fecal microbial communities of hamsters fed plant sterols esterified with stearic acid (dark gray closed circles), and beef tallow (open circles) from animals fed a control diet (light gray closed circles). (B) Shannon's diversity index. *, P < 0.05.

