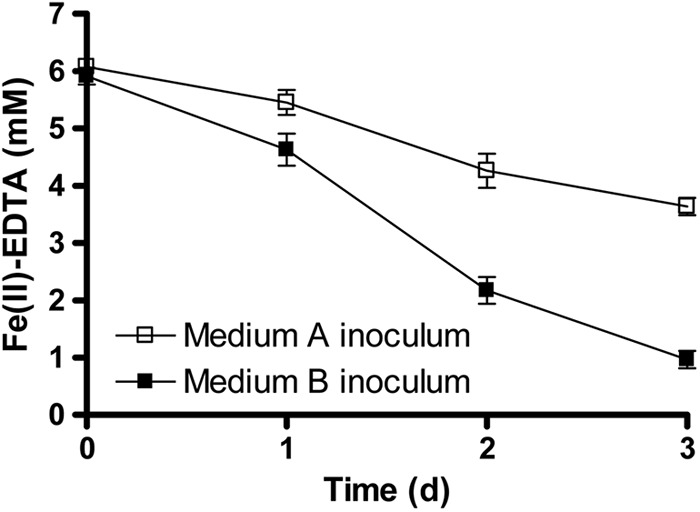
Fig 2.

Comparison of Fe(II)-EDTA oxidation by Acidovorax sp. 2AN grown in medium A [without any Fe(II)] versus cells grown in medium B [with Fe(II)-EDTA]. The initial concentrations of cells were in the range of 11.4 × 10⁷ to 13.3 × 10⁷ cells/ml, and Fe(II)-EDTA was present at an initial concentration of ca. 6.1 mM. Data are presented as means ± standard deviations (n = 3). When not shown, error bars are smaller than the symbols.
