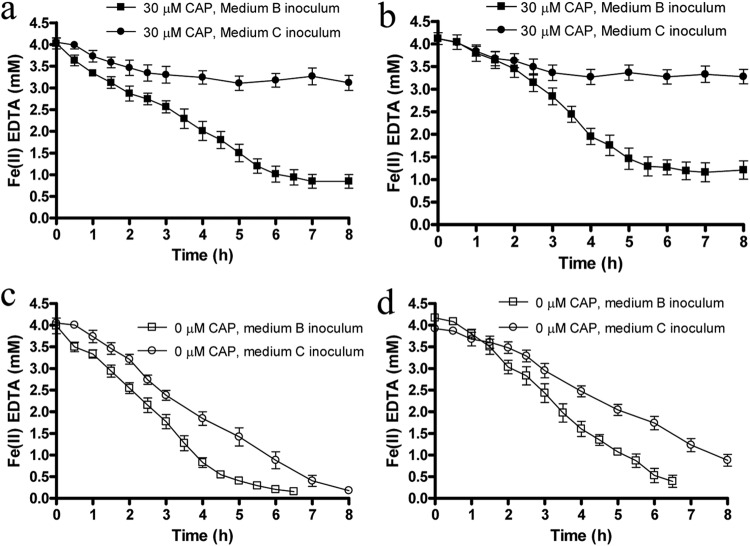
Fig 3.
Fe(II)-EDTA oxidation in cell suspensions of resting cells of Acidovorax sp. 2AN (a and c) and Dechloromonas sp. UWNR4 (b and d) in the presence (a and b) and absence (c and d) of 30 μM CAP. The figure shows Fe(II) oxidation in reactors containing cells that were previously incubated with Fe(II)-EDTA (medium B inoculum) or with Fe(III)-EDTA (medium C inoculum). All cell suspensions initially contained ca. 4 mM Fe(II)-EDTA, 5 mM NO3−, and 1.2 mM ethanol. Data are presented as means ± standard deviations (n = 3). When not shown, error bars are smaller than the symbols.

