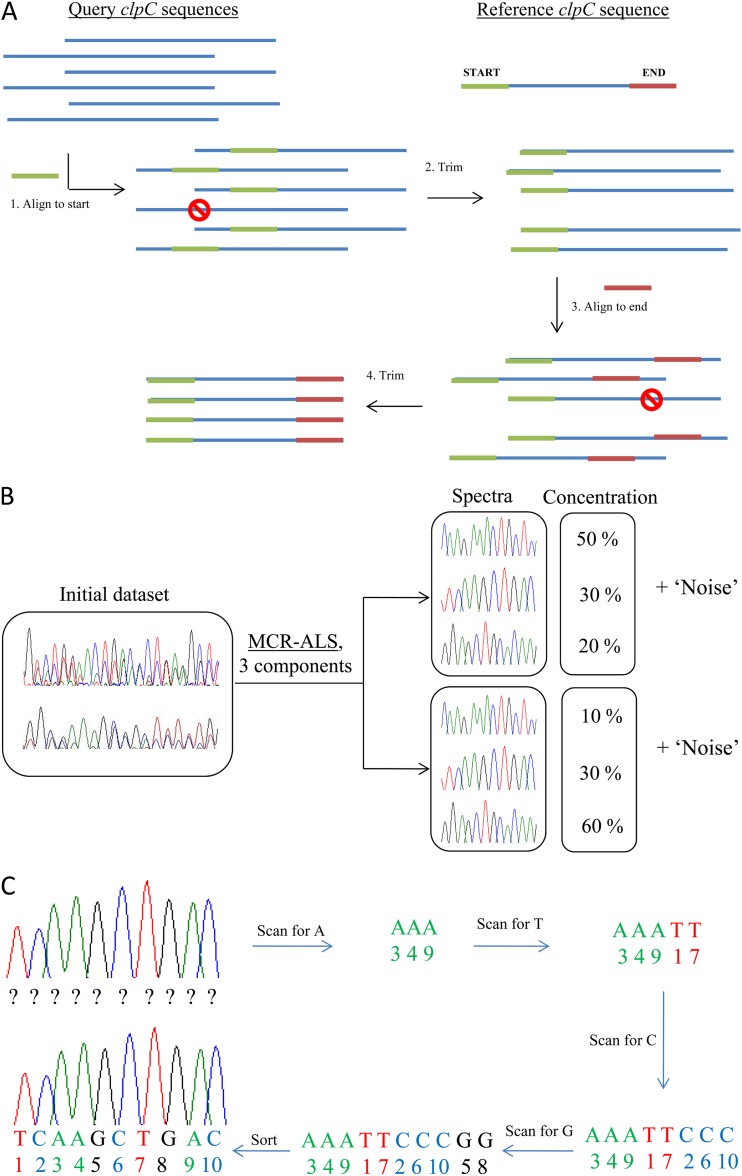
Fig 2.
Simplified scheme of mixed sequence analysis. (A) Alignment of mixed sequences. All sequences have the same start and end, as well as a variable region in the middle. (B) MCR-ALS. Pure spectra common for all (the majority of) samples and their relative amounts in each sample are identified. (C) Base calling of pure MCR-ALS-resolved spectra. The nucleotide sequence of each of the pure resolved spectra is identified.

