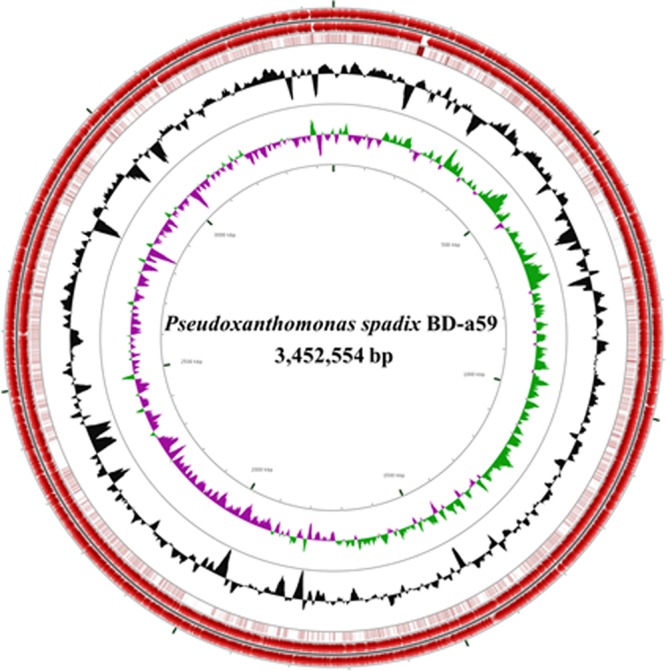
Fig 1.

A circular map of the genome of P. spadix BD-a59. Forward-strand and reverse-strand CDSs (red) are depicted on the outermost two circles of the map, respectively. The third circle represents the BLASTN comparison of strain BD-a59's genome to strain 11-1's genome (dark brown indicates highly homologous CDSs). G+C content (black) and GC skews (positive GC skew, green; negative GC skew, violet) are shown on the fourth and fifth circles, respectively.
