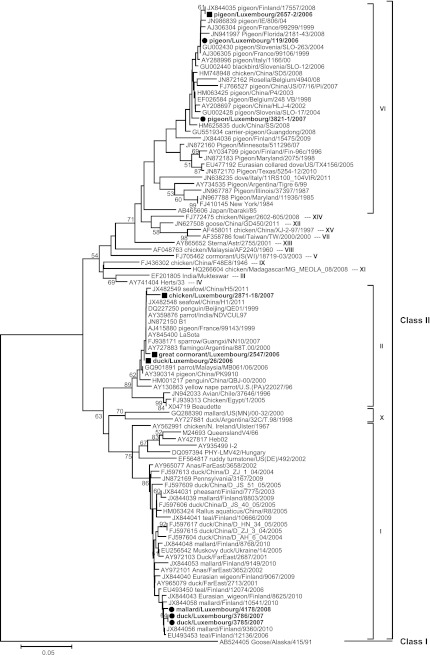
Fig 2.
Phylogenetic analysis of partial F gene sequences based on nucleotides 332 to 571. Sequences generated in this study are indicated by the circles (strains presented in Fig. 2 and Fig. 3) and squares (strains presented in Fig. 2 only). Previously published sequences are indicated with their accession numbers. Only bootstrap values of ≥50% are shown. The scale corresponds to number of base substitutions per site.

