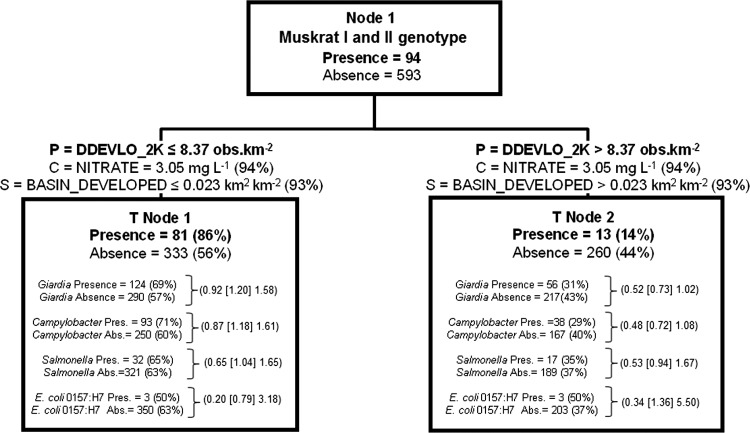
Fig 5.
Classification tree delineating the presence and absence of muskrat I and II genotypes derived from independent variables given in Table S1 in the supplemental material. The tree begins with all data (node 1), which is then split into two child nodes by independent criteria until node-splitting-stopping conditions are met. P, optimal split criterion for node; C, competitor variable; S, surrogate variable The percentages in parentheses for C and S were calculated as follows: top competitor and surrogate variable improvement score divided by the optimal node split criteria improvement score, multiplied by 100. The percentage in parentheses for node presence or absence of muskrat I and II genotypes is calculated as the node total presence or absence divided by the respective node 1 presence and absence data, multiplied by 100. For each terminal node of data, the number of other zoonotic pathogens present or absent and the percent present or absent based on total presence or total absence for the entire data set (node 1) are given. Odds ratios (data in parentheses are arranged, respectively, as the lower 95% CI limit [odds ratio estimate] upper 95% CI limit) for zoonotic pathogens are given for each terminal node. They were calculated as the odds of a pathogen occurring in a given terminal node in relation to the odds of the same pathogen occurring in node 1. See the legend of Fig. 3 for instructions on how to read tree models.

