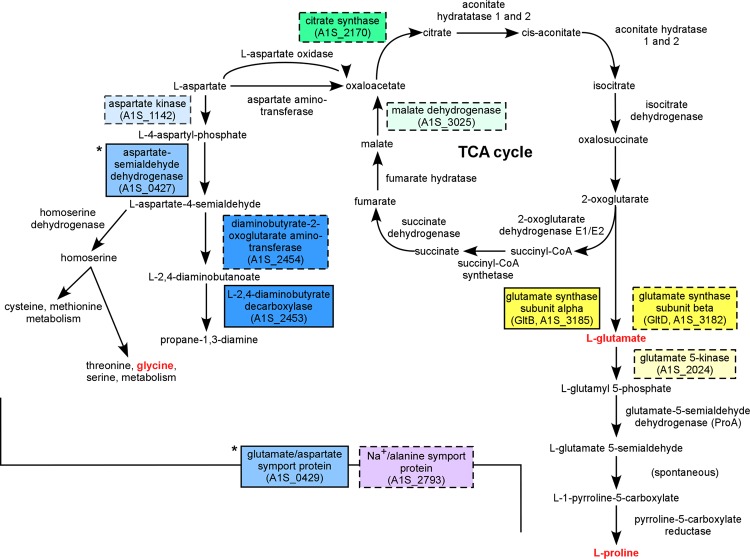
Fig 2.
Metabolic pathways disrupted in colistin-sensitive mutants of A. baumannii. Colored boxes indicate enzymes or transporters whose gene or predicted operon was disrupted in one of the colistin-sensitive transposon mutants. Dashed borders indicate genes that were directly disrupted by the transposon insertion or the immediate downstream genes if the insertion was intergenic. Boxes of the same color indicate genes in the same predicted operon. Asterisks indicate genes in a predicted operon upstream of a transposon insertion site. Names of amino acids or compatible solutes that contribute to osmotic protection are indicated with red lettering.

