Fig 2.

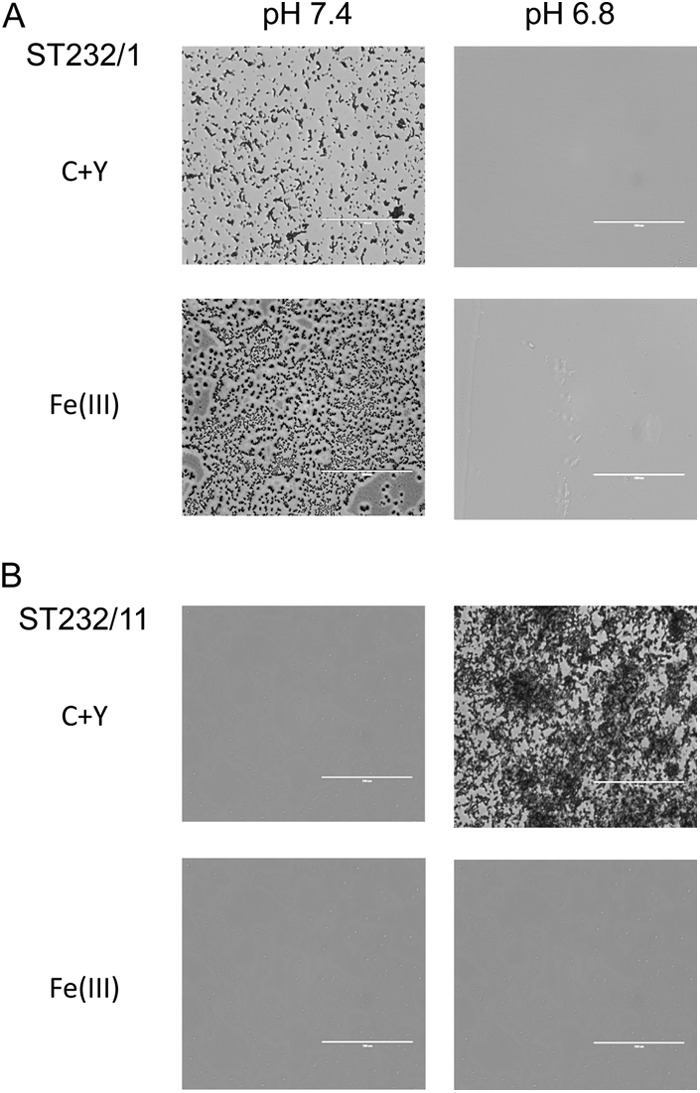
Microscopic analysis of crystal violet-stained 24-h biofilms of the blood isolate ST232/1 (A) and the ear isolate ST232/11 (B) grown at pH 7.4 or 6.8 in the presence or absence of 100 μM Fe(III). Scale bar, 100 μm.

Microscopic analysis of crystal violet-stained 24-h biofilms of the blood isolate ST232/1 (A) and the ear isolate ST232/11 (B) grown at pH 7.4 or 6.8 in the presence or absence of 100 μM Fe(III). Scale bar, 100 μm.