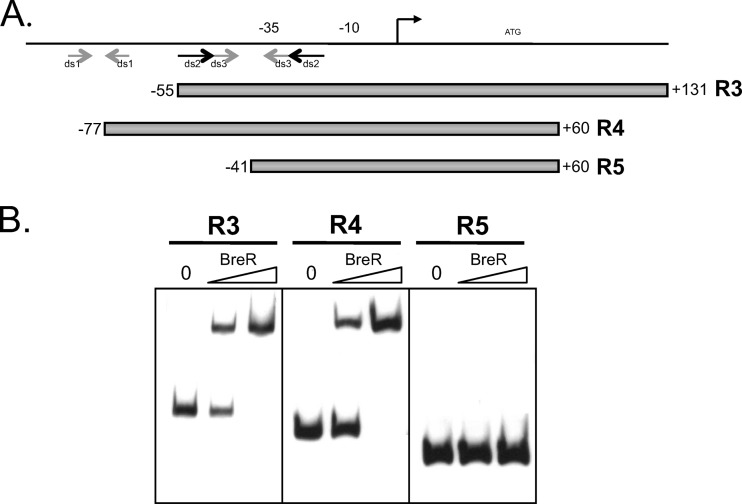
Fig 1.
Mapping of the BreR binding site within the breR promoter region using EMSA and dyad symmetry prediction. (A) Schematic representation of the R1 fragment showing the regions of dyad symmetry predicted by the Vienna program. Putative regions of dyad symmetry (ds1, ds2, and ds3) are indicated by gray or black arrows. Various DNA fragments (R3, R4, and R5) used for EMSA are shown by gray boxes. The transcriptional start site is indicated by a black arrow. The ATG start codon and putative −35 and −10 regions are also shown. (B) EMSA showing BreR binding to breR promoter region fragments R3, R4, and R5. In each panel, 10 ng DIG-dUTP-labeled DNA was incubated with 0 (first lane), 50 (second lane) or 250 ng (third lane) of purified BreR-His6 prior to electrophoresis.

