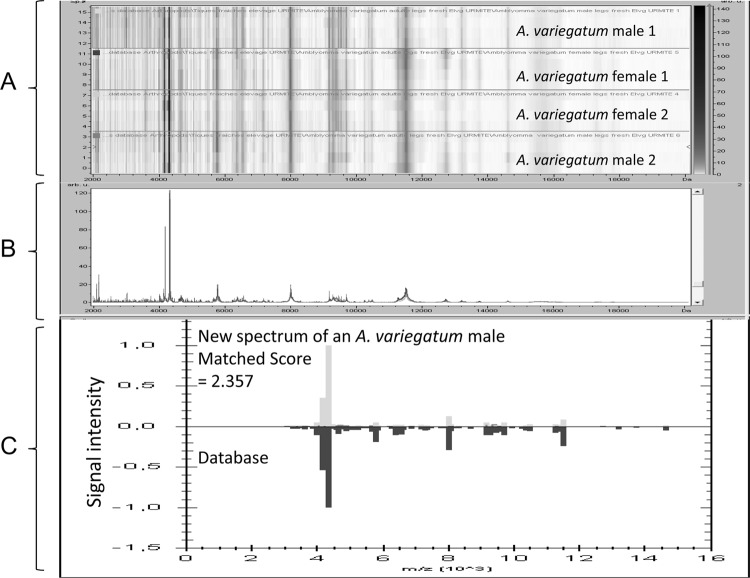
Fig 2.
Comparison of the A. variegatum spectral profiles to assess reproducibility and to identify an A. variegatum specimen. (A) Alignment of the spectra of several specimens of A. variegatum (gel view) showing that the major identified protein peaks were present in each specimen of this species. Arb u, arbitrary units. (B) Average peak list for the A. variegatum spectral profiles. (C) Results obtained for the blind testing of an A. variegatum specimen against the database using MALDI Biotyper, version 3.0, software (correct identification with a score of 2.357).

