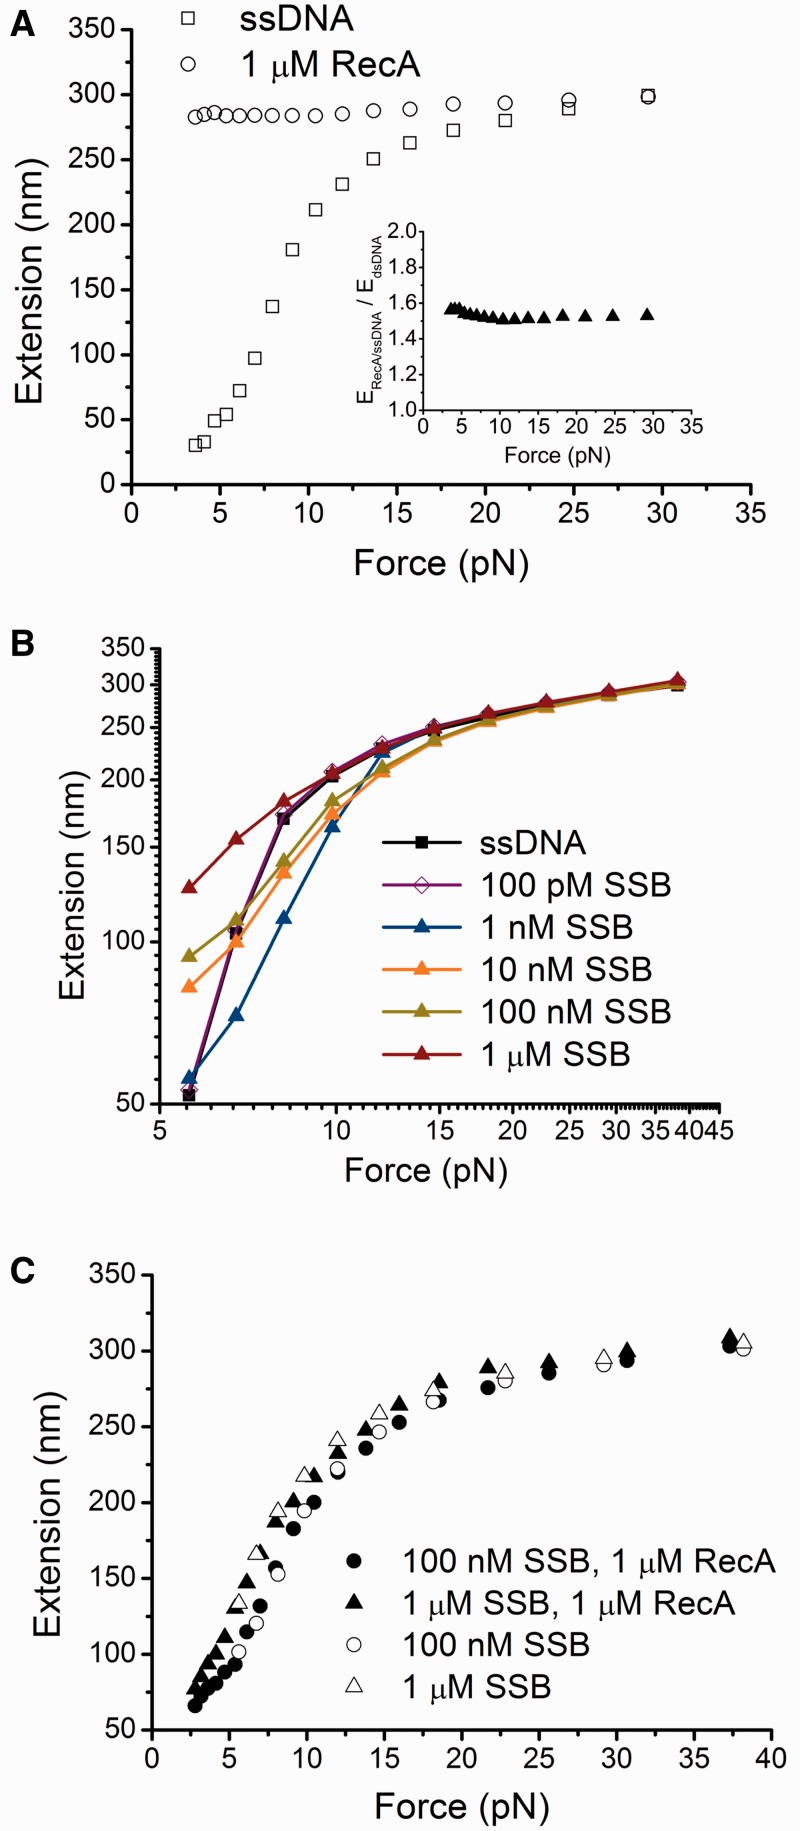
Figure 2.
Effects of RecA and SSB on force responses of ssDNA. (A) Black open circles indicate the force-extension curve of ssDNA bound by a fully coated RecA nucleoprotein filament formed with ATP. Black open squares indicate the force-extension curve of the same ssDNA before RecA binding. Inset shows the extension of a fully polymerized RecA nucleoprotein filament measured in experiments divided by the theoretical extension of a dsDNA of equal number of base pairs (576 bp) at the corresponding force values based on the worm-like-chain model of DNA (Eq. S1) (34). (B) Force responses of ssDNA incubated with different concentrations of SSB. (C) Force-extension curves of ssDNA obtained with incubation with either 1 µM RecA and 100 nM SSB, or 1 µM RecA and 1 µM SSB in the presence of ATP. Data in 100 nM SSB or 1 µM SSB from (B) are plotted together for comparison. In each panel, the force-extension curves were recorded during the force-decrease scans. Data in (A–B) and data indicated by the open symbols in (C) were recorded after holding the ssDNA at large force (>15 pN) for >100 s in the protein solutions. Data indicated by the solid symbols in (C) were recorded after the protein solution was slowly introduced at low force (<5 pN).

