Figure 6.
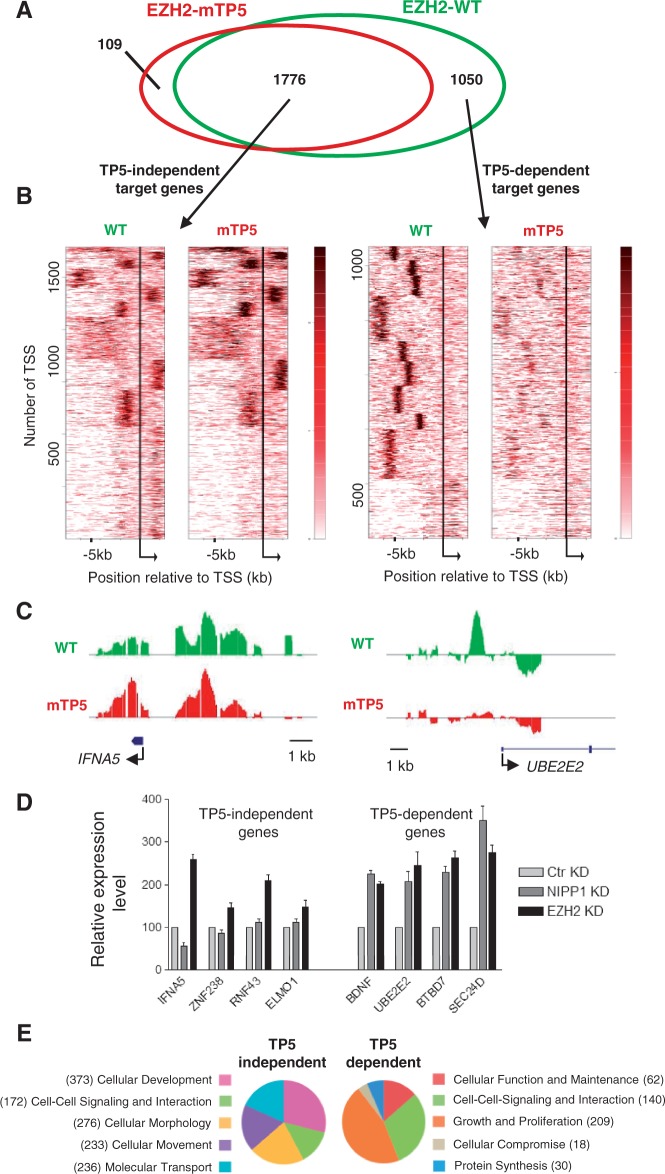
A NIPP1-binding mutant of EZH2 shows aberrant association with proliferation-related target genes. (A) Target genes of EZH2-WT (green) and EZH2-mTP5 (red) are widely overlapping (1776 TP5-independent targets), but an important subset is EZH2-WT specific (1050 TP5-dependent target genes). (B) Clustering in relation to the TSS of the derived target genes. Bigwig files were clustered (k-means 10) in relation to the TSS of the TP5-independent target genes (left) or the TP5-dependent target genes (right) for the −7.5 kb to +2.5 kb region, using the heatmap tool of the cistrome online resource. Calculation of the clusters was based on the combined WT and mTP5 data sets. Although a high degree of similarity of the two data sets is observed for the set of TP5-independent target genes, the mTP5 signal is clearly reduced in comparison with WT for the TP5-dependent target genes. Moreover, EZH2 chromatin binding at TP5-dependent target genes is generally located more upstream of the TSS. (C) DamID-binding profile of EZH2 on a selected TP5-independent and TP5-dependent target gene across the promoter region. IFNA5 is found in cluster 3 of the TP5-independent gene list and UBE2E2 belongs to cluster 10 of the TP5-dependent gene list. (D) The relative expression levels of the indicated genes were determined by qRT-PCR in HeLa cells that were treated with control (Ctr), NIPP1 or EZH2 siRNAs. ACTIN was used as control for normalization. (E) Pie-charts showing the top five classes of a comparative analysis for molecular and cellular functions using IPA. Genes can be present in more than one functional category.

