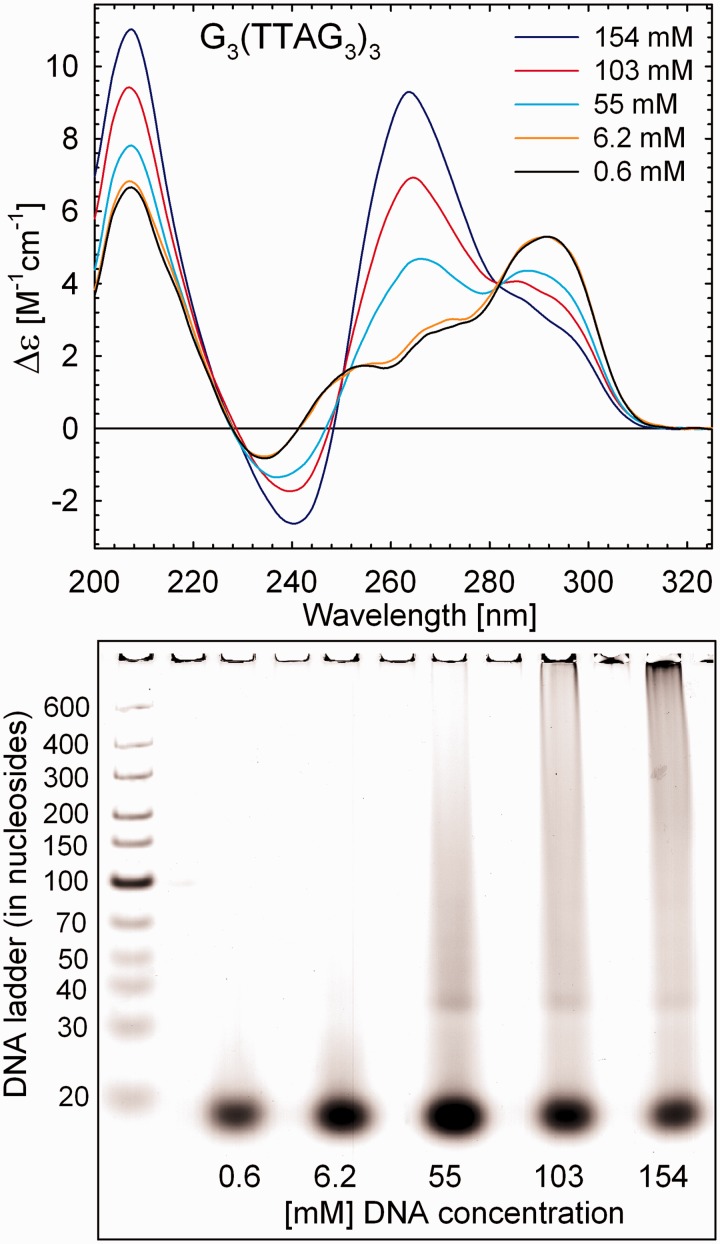
Figure 2.
Dependence of CD spectra of G3(TTAG3)3 on DNA concentration at 23°C. Each sample was slowly annealed after dilution to the final DNA concentration. Concentration of K+ in all samples was 300 mM. Bottom: native PAGE of K+-stabilized G3(TTAG3)3 at indicated DNA concentrations. The PAGE was performed at 20°C in 30 mM of PBS containing 240 mM of K+, pH 6.7.

