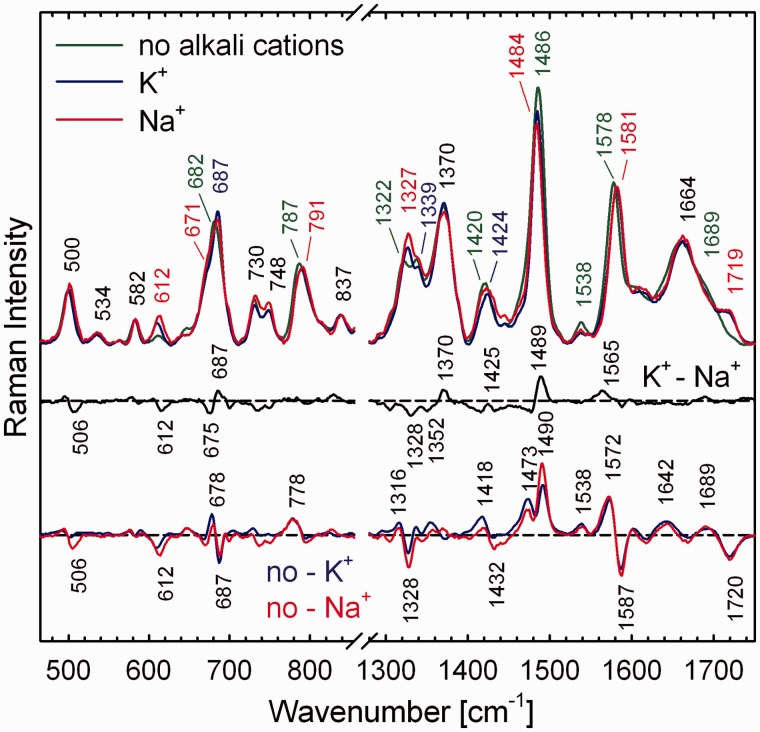
Figure 7.
Spectral differences between non-quadruplex G3(TTAG3)3 structure at extremely high DNA concentration (520 mM; no alkali cations present) and initial quadruplex structures adopted by highly concentrated G3(TTAG3)3 (330 mM) after adjustment of K+ or Na+ concentrations to 230 mM, but before annealing.

