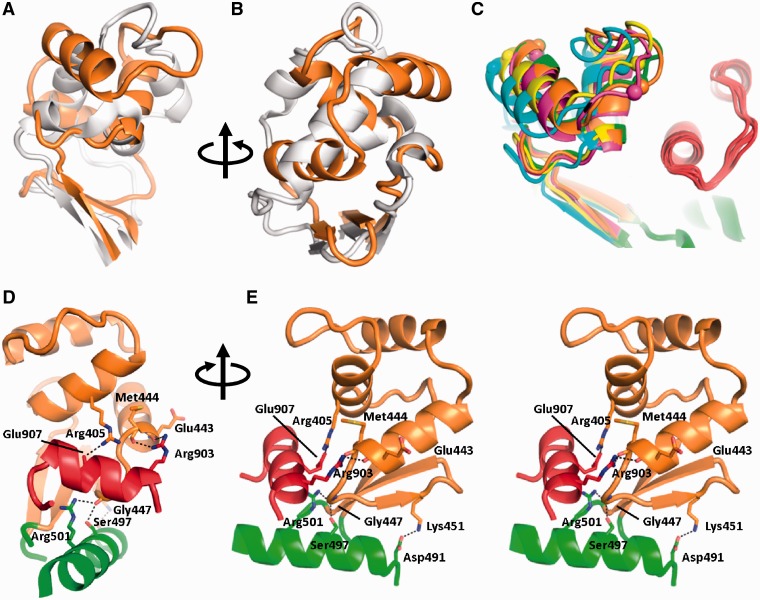
Figure 3.
Comparison of the latch structures. (A) Superposition of A. fulgidus (gray) and T. maritima (orange) reverse gyrases. The latch domains are connected to the H2 domains by a short β-sheet but have very different structures and orientations. (B) View rotated 90° around the vertical axis. (C) Superposition of the five T. maritima reverse gyrase structures (yellow, orange, magenta, cyan, green) on H2 (green, bottom right) reveals structural plasticity of the latch domain while the topoisomerase domain remains immobile (also compare Figure 2A). Spheres serve as markers for the magnitude of the structural differences in the latch domains. The orientation is the same as in (A). The part of the topoisomerase domain interacting with the latch is shown in red. (D) Thermotoga maritima reverse gyrase latch/topoisomerase interactions. Possible hydrogen bonds are drawn as dashed lines. (E) Stereo view rotated 90° about the vertical axis.

