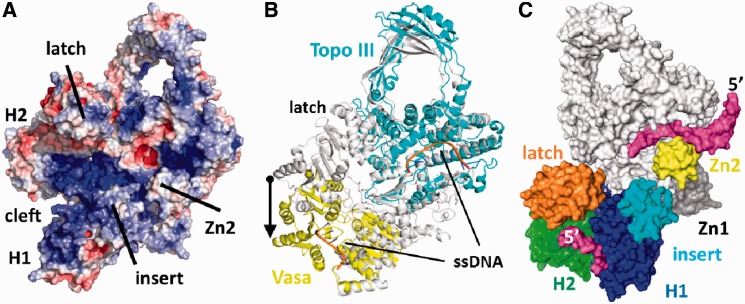
Figure 5.
Generation of a model for reverse gyrase with the helicase domain in the closed conformation. (A) Electrostatic surface potential calculated using APBS (41) and displayed at ±5 kbT. Positive potential (blue) suggests a continuous DNA-binding site from H1 to the topoisomerase domain. (B) Comparison of reverse gyrase with the closed conformation of the RNA helicase Vasa (42) in complex with Mg2+/ADPNP and oligo-U RNA (PDB-ID 2DB3; yellow) and with the E. coli DNA topoisomerase III/ssDNA (PDB-ID 1I7d; cyan) complex (19). The arrow depicts the magnitude of the projected H2 movement upon closure of the helicase domain. (C) Surface model of reverse gyrase with the helicase domain in the closed conformation. Large conformational changes of H2 and the latch relative to the topoisomerase domain are required. Bound DNA is shown in magenta. H1 and H2 are colored blue and green, respectively. Possible DNA interacting areas such as the latch, the insert region and the topoisomerase-based zinc fingers are colored separately. The topoisomerase domain is kept white and the directionality of the modeled ssDNAs is indicated by their 5′-end.

