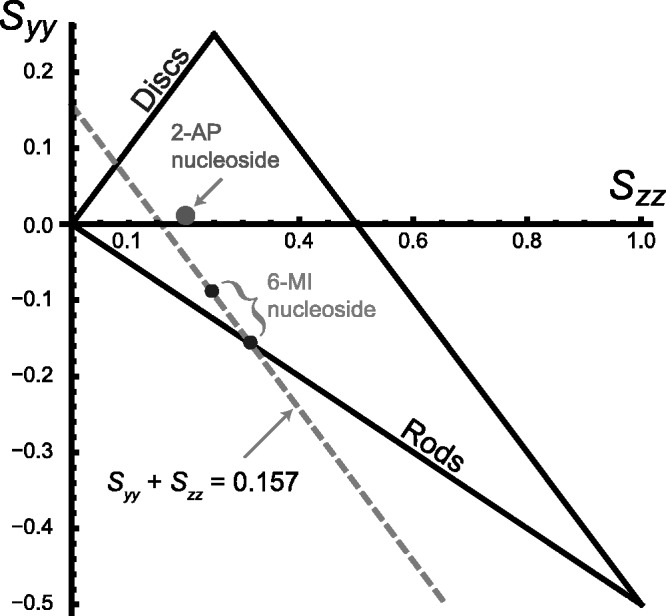
Figure 3.

An orientation triangle for anisotropic molecules in stretched polymer films. The large dot specifies the in-plane orientation parameters obtained for 2-aminopurine nucleoside [24]. The upper small dot indicates the orientation parameters corresponding to the largest possible value of  that is consistent with the experimental LDr data for r(6-MI). Because
  (=−0.157) is defined by the experimental LDrs of the out-of-plane polarized transitions, the values of
  and
and  must fall on the line:
  [see Equation (6)]. The intersection of this line (dashed grey) with the boundary of the orientation triangle (lower small dot) yields the smallest value of
  , and the largest value of
  that are consistent with the experimental data.
