
Figure 4.
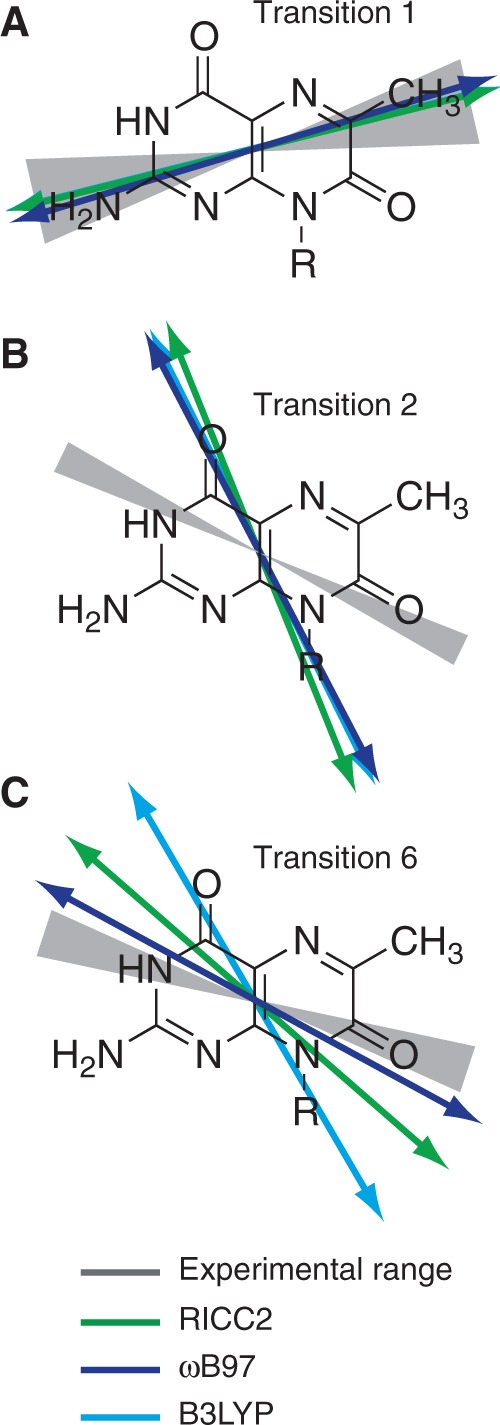
The results of experimental and calculated in-plane polarized EDTMs of 6-MI are shown. Grey hourglass regions indicate the range of EDTM orientations corresponding to the experimental limits for  (indicated by upper and lower small dots in Figure 3). The green (RICC2), dark blue (ωB97) and light blue (B3LYP) arrows indicate the EDTMs obtained from calculations. (A) Transition 1; (B) Transition 2; (C) Transition 6.