
Figure 4.
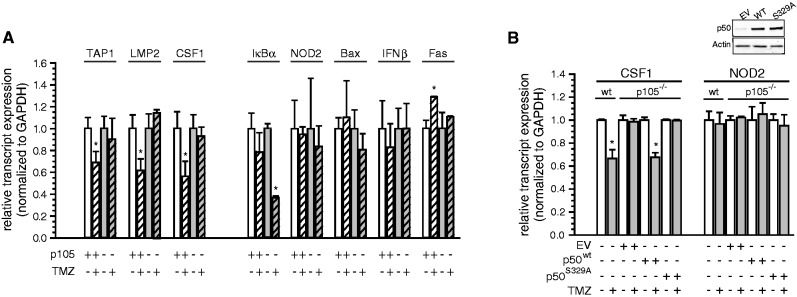
Differential expression of genes with −1C and −1A κB-sites following DNA damage. (A) qPCR of endogenous mRNA in sh-control and sh-p105 expressing U87 cells treated with 100 μM TMZ or vehicle (16 h). Data show relative mRNA expression normalized to control ± SEM of triplicate samples from three separate experiments. *P < 0.05. (B) qPCR analysis of CSF1 and NOD2 mRNA expression in wt MEFs and p105−/− MEF stable clones expressing empty vector (EV), p50wt or p50S329A following treatment with 100 μM TMZ or vehicle (16 h). Data show mean values normalized to control ± SEM of triplicate samples from three experiments. *P < 0.05. Inset: immunoblot with anti-p50 and anti-actin.