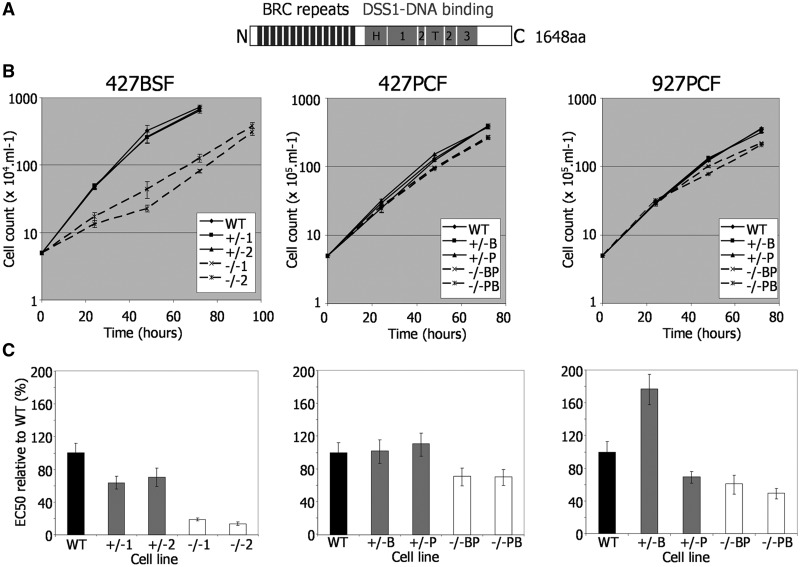
Figure 1.
Growth and repair efficiency of T. brucei BRCA2 mutants. (A) Locations of conserved domains are shown diagrammatically within the T. brucei BRCA2 polypeptide: BRC repeats (black boxes), and sub-domains of the DSS1-DNA binding region (grey boxes: H, helical domain; T, tower domain; 1, 2, 3, OB domains). (B) Growth is shown of WT, BRCA2 heterozygous (+/−) and brca2 homozygous (−/−) mutants cells in T. brucei Lister427 bloodstream form (427BSF) cells and in PCF cells from Lister427 (427PCF) and TREU927 (927PCF) strains. Cell densities were measured in vitro at 24 h intervals; bars indicate standard errors from three experiments. (C) EC50 values of the same T. brucei BSF and PCF strains are shown, comparing WT, BRCA2+/− and brca2−/− cells exposed to phleomycin. EC50 values are the mean from three experimental repetitions expressed as a percentage of WT; bars indicate standard error.

