Figure 6.
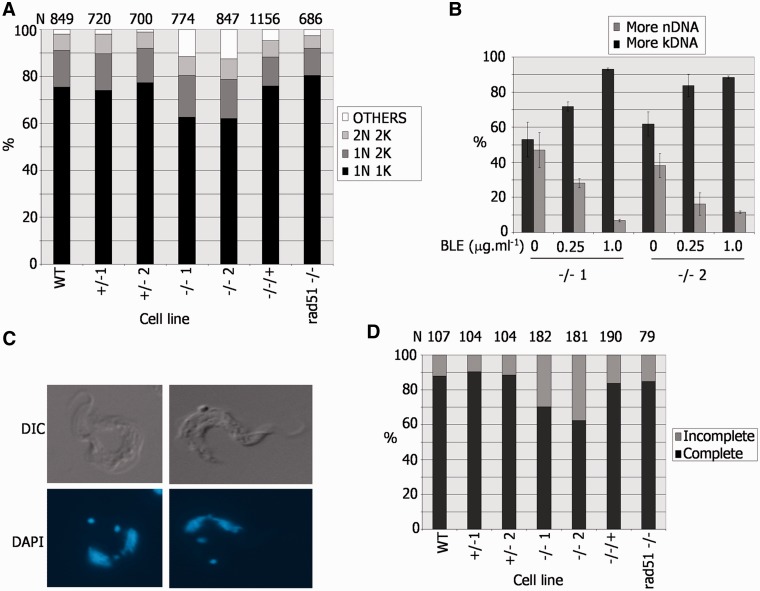
A DNA replication or segregation defect in T. brucei bloodstream form BRCA2 mutants. (A) Nucleus (N) and kinetoplast (K) configurations of individual cells in a population were analysed by DAPI staining and microscopic examination. The percentage of cells with standard (2N2K, 1N2K and 1N1K) or aberrant (other) N–K configurations is shown in WT Lister427 BSF T. brucei, in BRCA2+/− or brca2−/− mutants, in brca2−/− cells in which full-length BRCA2 was re-expressed (−/−/+), and in rad51−/− mutants; the number of cells counted (N) is shown above the graph. (B). Analysis of aberrant N–K configurations in two independent brca2−/− mutants (1 or 2), detailing whether kDNA or nDNA content was raised, before and after growth for 18 h in phleomycin (BLE). (C) Examples of 2N2K brca2−/− cells undergoing nuclear segregation. (D). Analysis of 2N2K cells from the populations described in A, detailing whether the nuclei were in the process of (incomplete) or had completed (complete), segregation; N is indicated.

