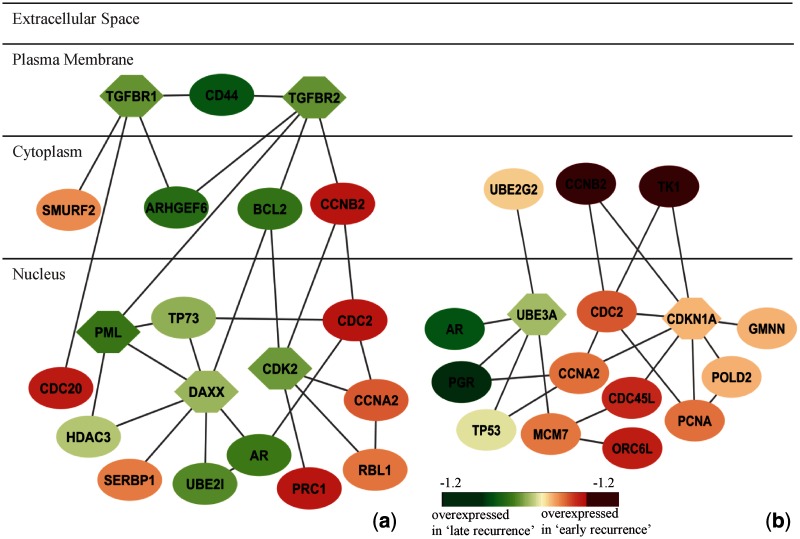
Figure 6.
Subnetworks identified from (a) Wang et al. (2005) and (b) van de Vijver et al. (2002). Subnetworks are merged if more than two genes are common. Node shape indicates the seed gene (hexagon) or non-seed gene (ellipse). Node color indicates the fold change between ‘early recurrence’ and ‘late recurrence’ groups. Red represents overexpressed in the ‘early recurrence’ group; green reflects overexpressed in the ‘late recurrence’ group. Enriched pathways and GO functional annotations are: (a) Cell cycle pathway: P = 2.91 e-10; breast cancer oestrogen signalling: P = 4.3 e-05; (b) Cell cycle: P = 3.18E-15; breast cancer oestrogen signalling: P = 4.02 e-07.

