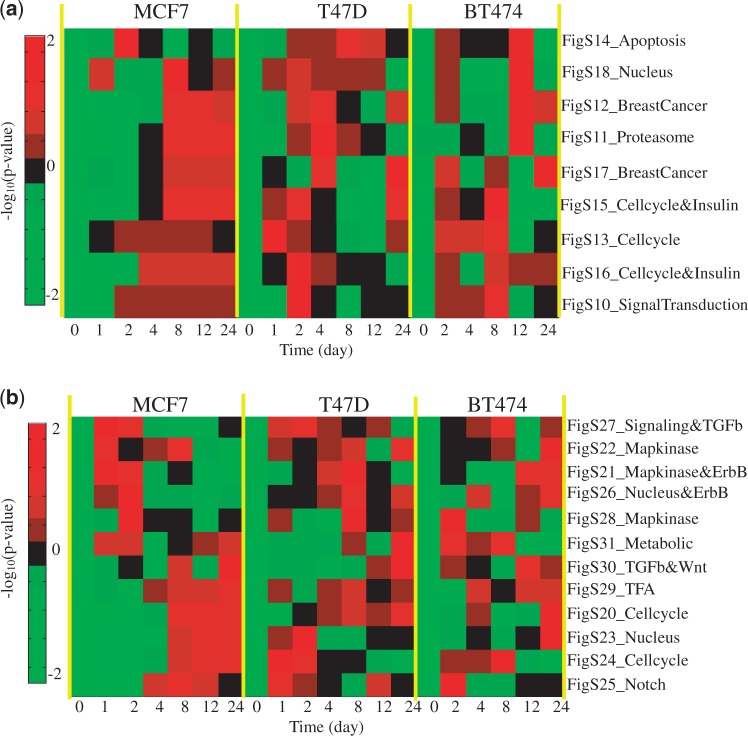
Figure 9.
Enrichment analysis of identified subnetworks by oestrogen-stimulated cell line data: (a) subnetworks from untreated breast tumour data; (b) subnetworks from tamoxifen-treated breast tumour data. Note that the heatmap shows the normalized −log10(P-value) across different time points for each subnetwork.

