Figure 4.
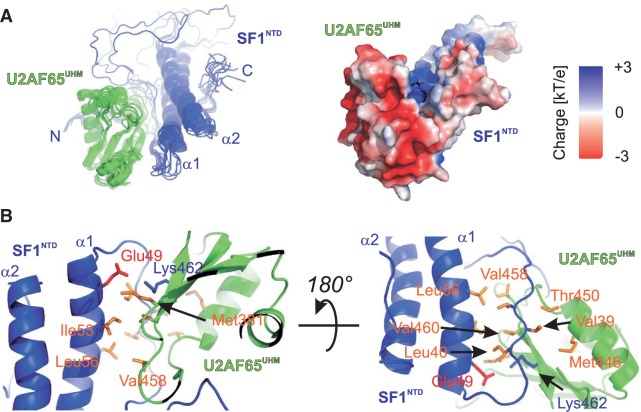
Structure of the SF1NTD and U2AF65UHM complex. (A) Ribbon representation of the ensemble of the 10 lowest energy structures and surface representation coloured according to electrostatic surface potential at 3 kT/e for positive (blue) or negative (red) charge potential using the program APBS (36). (B) Close-up view of SF1NTD–U2AF65UHM complex interface. Side chains of key residues mediating the interactions between the α-helices and the N/C-termini are shown as sticks.

