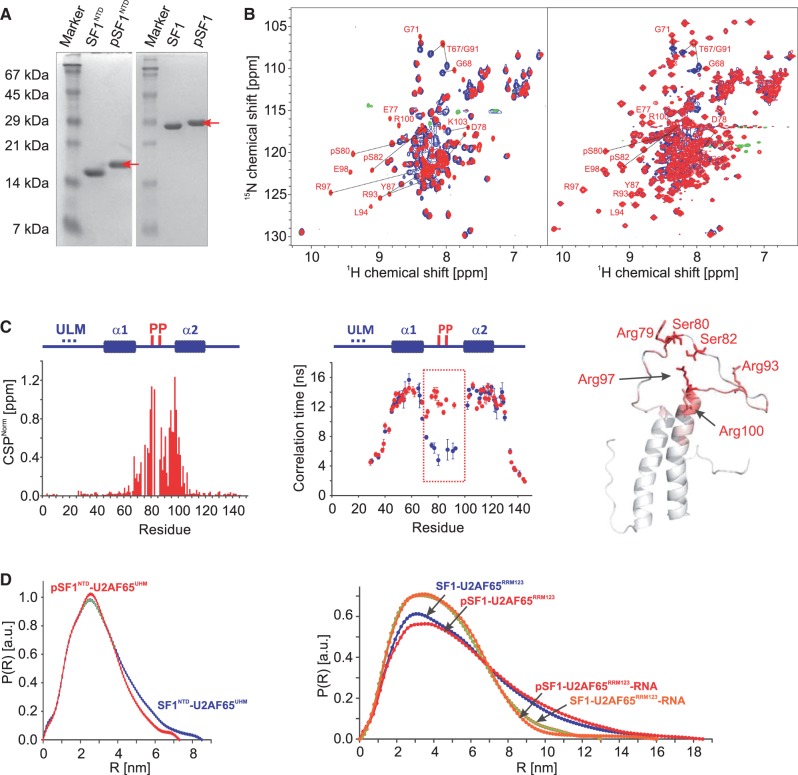
Figure 5.
NMR and SAXS analysis of the effect of tandem serine phosphorylation of SF1. (A) SDS–PAGE analysis of phosphorylation of SF1NTD and SF1. The phosphorylated protein (red arrow) migrates slower on the gel than the non-phosphorylated. (B) Superposition of 1H,15N HSQC NMR spectra of non-phosphorylated (black) and phosphorylated SF1NTD and SF1 (red). Selected residues, which are shifted upon phosphorylation are annotated. (C) CSPs (red) and residue-specific local correlation times τc are shown for SF1NTD (blue) and pSF1NTD (red). The secondary structures and the phosphorylation sites are depicted above the diagram. The tandem phosphorylated linker region that rigidifies upon phosphorylation is highlighted by a box. A ribbon representation of SF1HH colour coded with the phosphorylation-induced CSPs is shown. (D) SAXS data showing comparisons of radial density distributions of non-phosphorylated and phosphorylated SF1NTD and SF1, in complex with U2AF65UHM, U2AF65RRM123 and with U2AF65RRM123–RNA, respectively.

