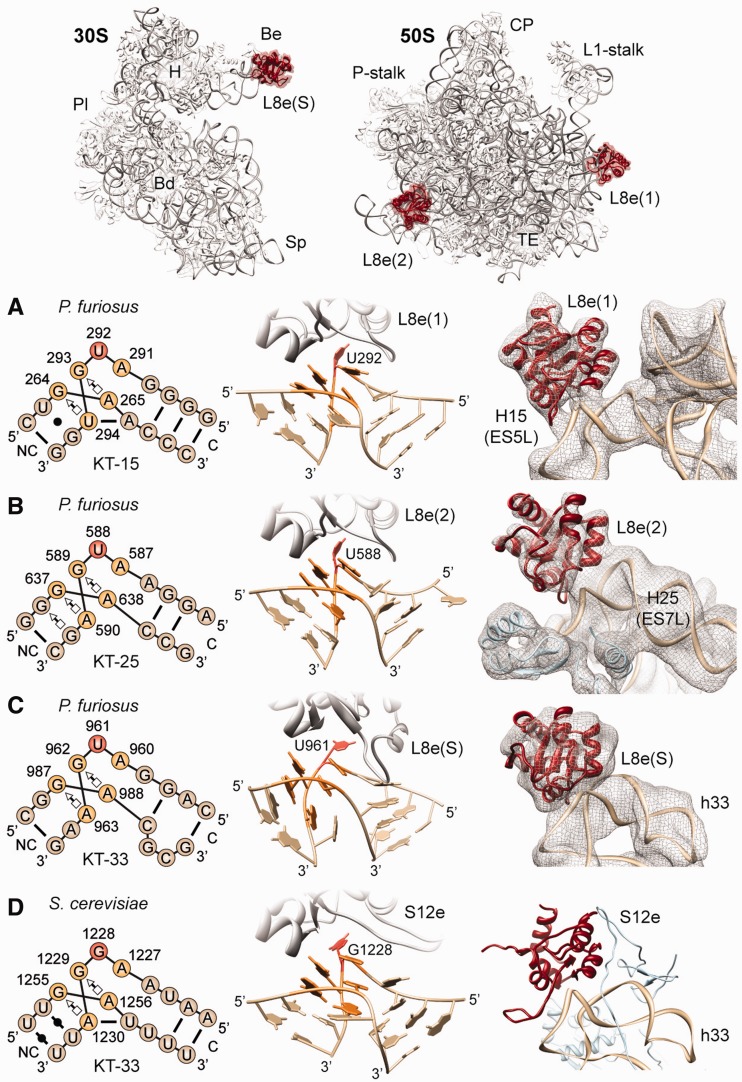
Figure 3.
Promiscuity of archaeal ribosomal protein L8e (L7ae). (A–D) Schematic (left) and structural (middle) representations of KT motif (A) KT-15 of the canonical L8e(1) binding site and (B) KT-25 at the L8e2 position, on the 50S subunit, compared with KT-33 at the (C) L8e(S) binding site on the P. furiosus 30S subunit and (D) S12e binding site on the S. cerevisiae 40S subunit (7). Right-hand panels show a fit of molecular models to the cryo-EM density (mesh) of P. furiosus 70S ribosome for (A) L8e(1) and (B) L8e(2) on the 50S subunit, and (C) L8e(S) on the small subunit, and in comparison (D), the binding position of S12e on the S. cerevisiae 40S subunit (7). Insets at top of figure show the overview of the L8e-binding positions (red) on the small (left) and large (right) ribosomal subunit. Major landmarks are indicated: beak (Be), body (Bd), platform (Pl), head (H), spur (Sp), central protuberance (CP) and tunnel exit (TE). C and NC indicate the canonical and non-canonical stem in KT diagrams. The cross-correlation of the fit of L8e crystal structure to the density for the different binding sites is as follows: L8e(1) = 0.90; L8e(2) = 0.87; L8e(S) = 0.81.

