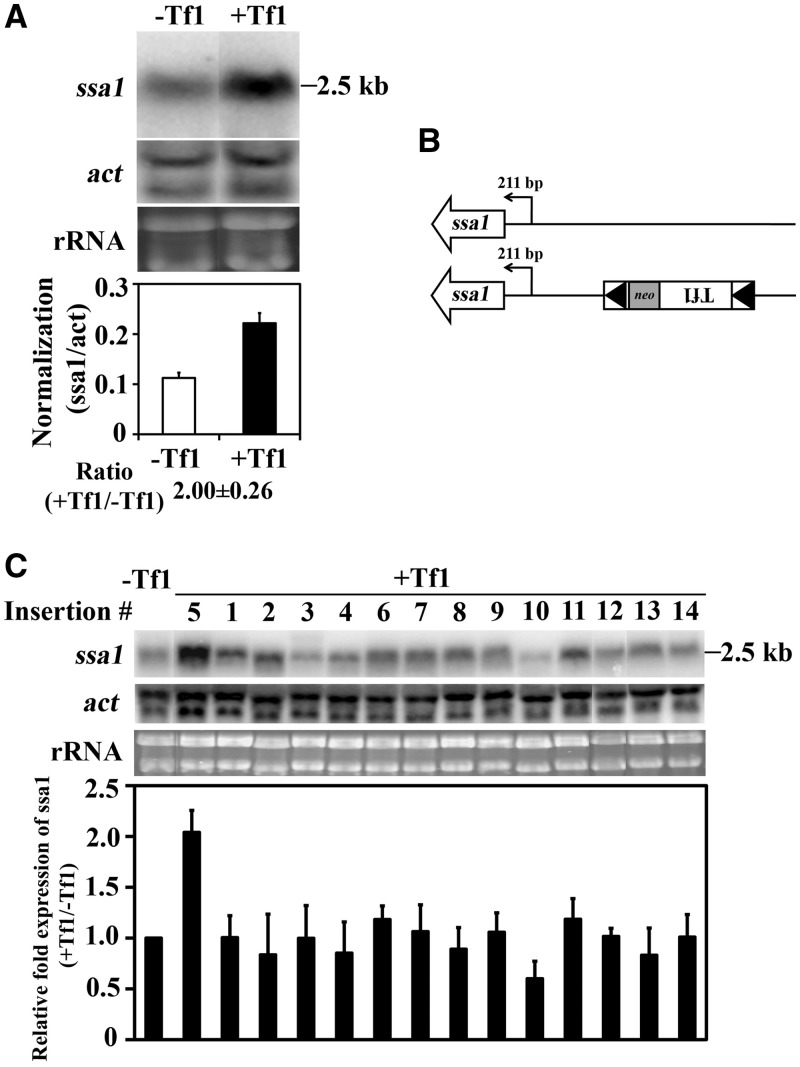
Figure 2.
Tf1 insertion increased the expression of ssa1. (A) The levels of ssa1 mRNA from cells lacking Tf1 and from cells with Tf1 upstream of ssa1 was measured on RNA blots. The amount of ssa1 mRNA relative to actin mRNA is shown in the histogram. (B) The transcription start site of ssa1 mRNA from cells with and without the Tf1 insertion at ssa1 was mapped by 5′ RACE and sequencing of the products. (C) The levels of ssa1 mRNA from cells without Tf1 and from all the 14 strains with Tf1 insertions were measured on an RNA blot. The histogram shows for each insertion strain the change in the expression of ssa1 mRNA caused by the insertion of Tf1.

