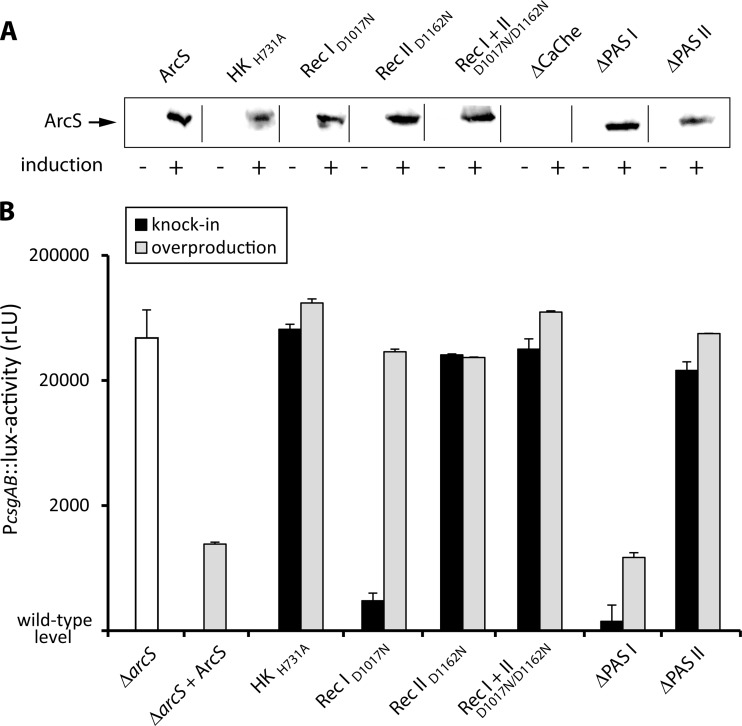
Fig 4.
In vivo analysis of the effect of ArcS substitution mutants on csgB expression. (A) Overproduction of His6-ArcS and its mutated variants (indicated at the top). Extracts of cells in which plasmid-borne expression was induced or not induced (as indicated at the bottom) were separated by SDS-PAGE. The proteins were specifically detected using antibodies raised against the N-terminal His tag. (B) csgB promoter activity depending on various levels of ArcS and its mutated variants under aerobic conditions. Promoter activity was determined by a chromosomally integrated PcsgB-lux fusion as light emission (RLU) relative to the OD600. Wild-type expression levels were almost below background levels (not shown). The white bar displays the activity in the absence of arcS. The black bars display the activity when arcS and corresponding mutants were expressed at chromosomal levels, and the gray bars display the activity when the corresponding proteins were overproduced. The error bars display the standard deviations from three independent experiments.

