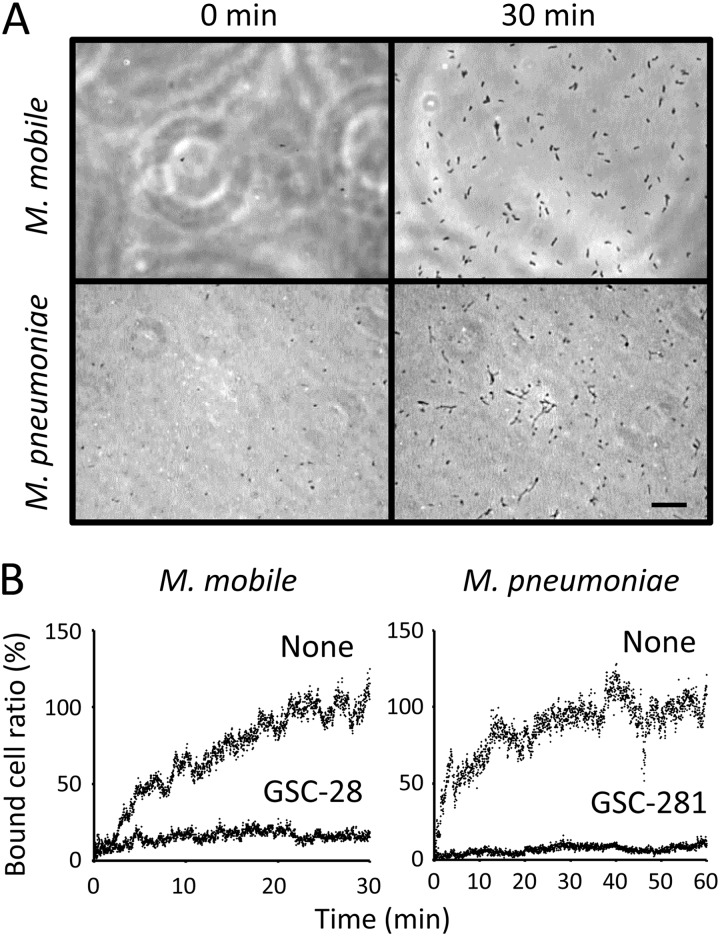
Fig 2.
Time course of mycoplasma binding to a glass surface. (A) Images of the glass surface at different time points. A mycoplasma suspension was inserted into a tunnel chamber, and an area of glass surface 64.0 μm wide and 85.3 μm long was observed. Bar, 10 μm. (B) Number of bound cells. Bound cells were counted every second and are presented as a ratio to the numbers at 30 and 60 min without sialylated compounds. The binding of M. mobile and M. pneumoniae was examined in the presence of 0.05 mM sialylated compounds, as indicated in each graph. For the analyses of M. pneumoniae, the gliding cells were counted as the number of bound cells.

