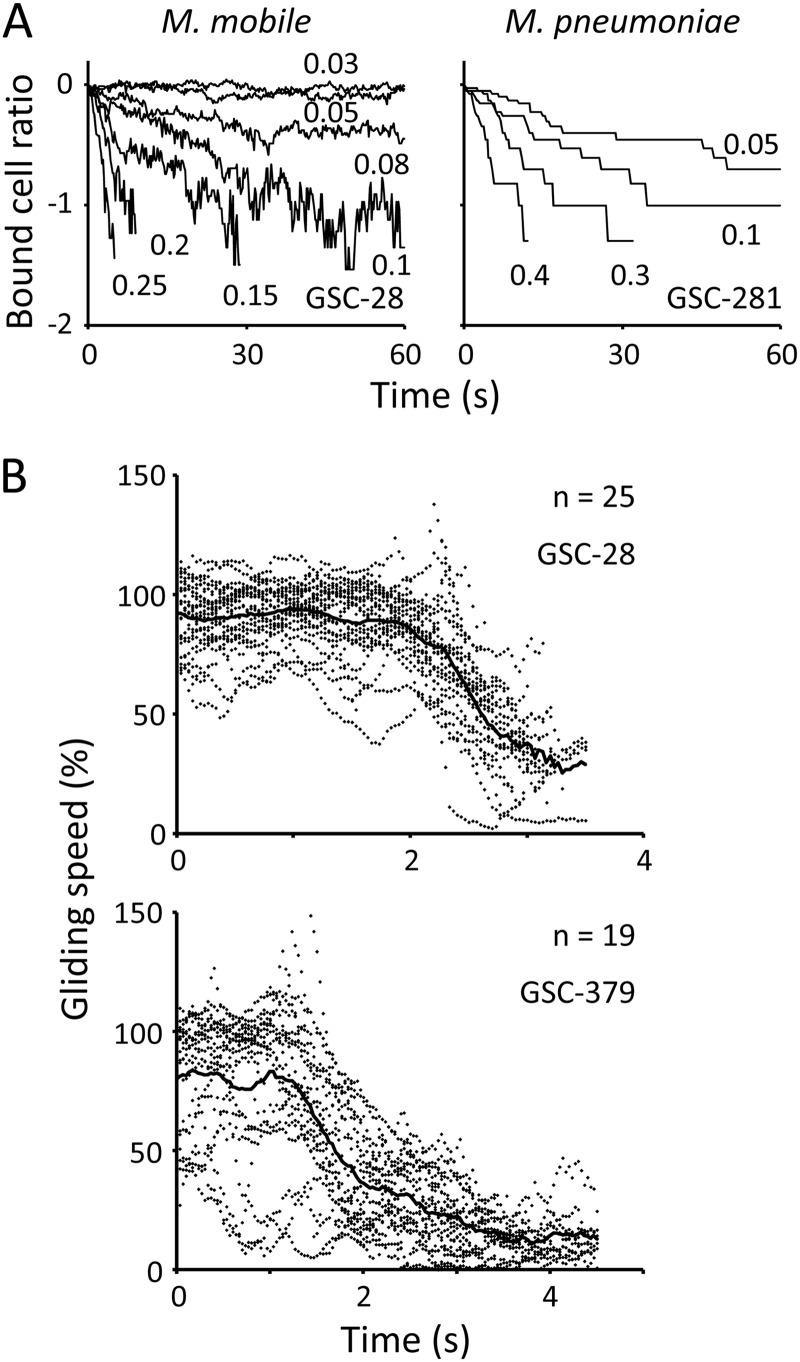
Fig 4.
Removal of gliding mycoplasmas by sialylated compounds. (A) Results for the most effective compounds. The number of bound M. mobile cells is presented for every 0.2 s as a ratio to the number at time zero, which was approximately 80 cells. Twenty cells of gliding M. pneumoniae were selected randomly and observed for every second. The concentrations of compounds used are presented in the graphs in millimoles. The y axes are logarithmic. The rate was measured from the slope of the graph at the addition of 1.0 mM free sialylated compounds and is summarized in Table 1. (B) Change in M. mobile gliding speed after addition of sialylated compound. The gliding speeds of individual cells are shown as dots for every 0.03 s. The average gliding speed is shown by a solid line. Gliding speeds are presented as ratios to the speed without compounds, 2.6 and 3.3 μm/s for the graphs of GSC-28 and GSC-379, respectively.

