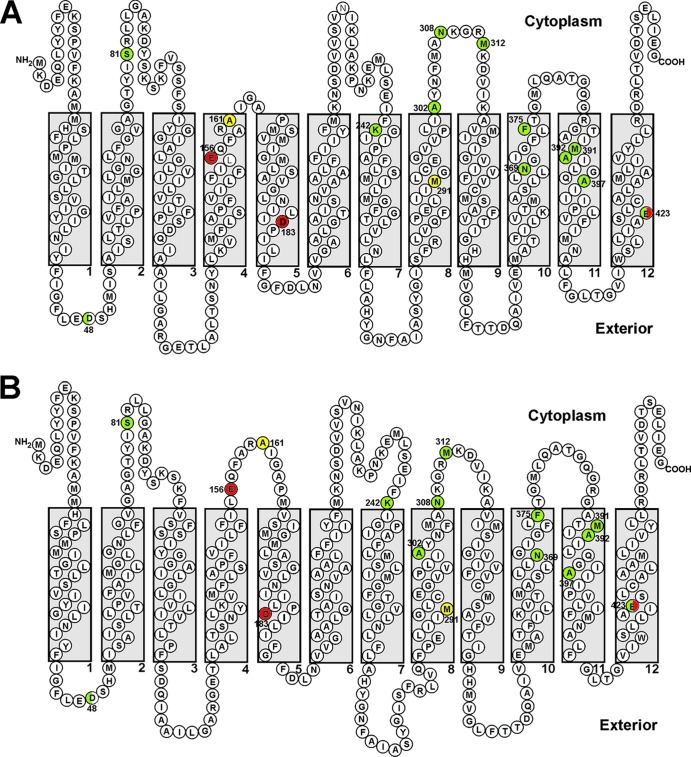
Fig 2.
Secondary structure of MepA, predicted using SOSUI (A) and TMHMM (B). Positions at which substitution mutations resulted in ≥50% increase in efflux activity are indicated in green, those resulting in increases of less than 50% in yellow, and those resulting in loss of efflux activity in red. Substitutions at positions 48 and 423 gave variable results depending on the particular amino acid present. This characteristic is illustrated by split colors for these residues.

