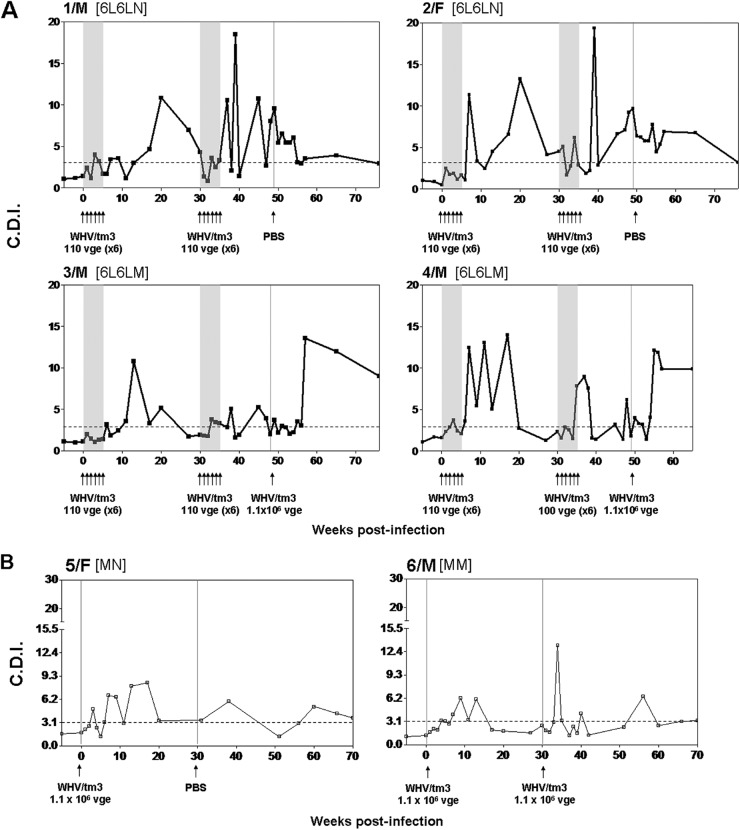
Fig 4.
Kinetics of WHV-specific T cell proliferative response in woodchucks exposed to two rounds of multiple low doses of WHV and in control animals infected with a liver-pathogenic dose of the same virus. Serial PBMC samples were stimulated in vitro with four different WHV antigens or the WHc97–110 peptide and analyzed for resultant proliferation using a CFSE-based proliferation assay to define the cell division index (CDI). The dashed horizontal line represents the cutoff value for the positive WHV-specific T response, the solid gray shaded area and the groups of 6 arrows under each panel show the time points at which animals were repeatedly injected with 1.1 × 10² virions, and a singular arrow shows the time point at which 1.1 × 10⁶ virions or PBS was administered. (A) Profiles of WHV-specific T cell responses in individual animals injected with two rounds of 6 weekly 1.1 × 10²-virion doses of WHV and then challenged or not challenged with a liver-pathogenic WHV dose of 1.1 × 10⁶ virions. (B) Profiles of WHV-specific T cell proliferative responses in two woodchucks injected with a single liver-pathogenic dose of 1.1 × 10⁶ virions and challenged with the same virus dose or injected with PBS. The results are presented as CDIs where the highest CDI value given by stimulation with any of the WHV antigens tested or the WHc97–110 peptide at a given time point was considered a measure of the WHV-specific T cell response. The subgroup designations are explained in Materials and Methods.

