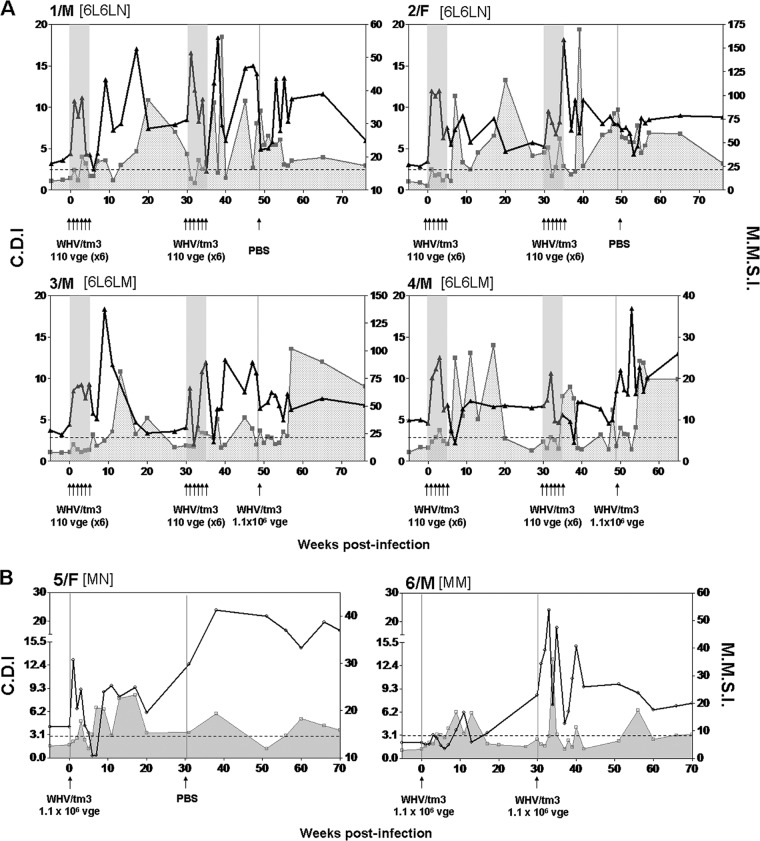
Fig 5.
Comparative kinetics of mitogen-induced (generalized) and WHV-specific T cell responses in woodchucks injected with multiple liver-nonpathogenic doses of WHV and in control animals infected with a liver-pathogenic dose of WHV. PBMCs were stimulated with five serial concentrations of ConA ranging from 1.2 to 20 μg/ml, and the resultant proliferation was measured by an adenine incorporation proliferation assay to determine the stimulation index (SI). The SI values obtained for all five concentrations of ConA were averaged to define the mean mitogenic stimulation index (MMSI), which are presented by the solid black lines. The dashed horizontal line represents the cutoff value for the positive WHV-specific T response, and a shaded area under a solid gray line outlines the profile of this response in each animal (the data imported from Fig. 4). The CDI values for WHV-specific T cell response and MMSI values after mitogenic stimulation are shown on the left and right y axes, respectively. (A) Comparative profiles of a lymphocyte proliferative response induced by ConA and WHV antigens in individual animals injected with two rounds of 6 weekly doses of 1.1 × 10² virions and then challenged or not challenged with a liver-pathogenic dose of 1.1 × 10⁶ virions. (B) Profiles of ConA-induced and WHV-specific T cell proliferative responses in two woodchucks injected with a single liver-pathogenic dose of 1.1 × 10⁶ virions and challenged with the same virus dose or injected with PBS. Other markings and the subgroup designations are explained in the legend to Fig. 1.

