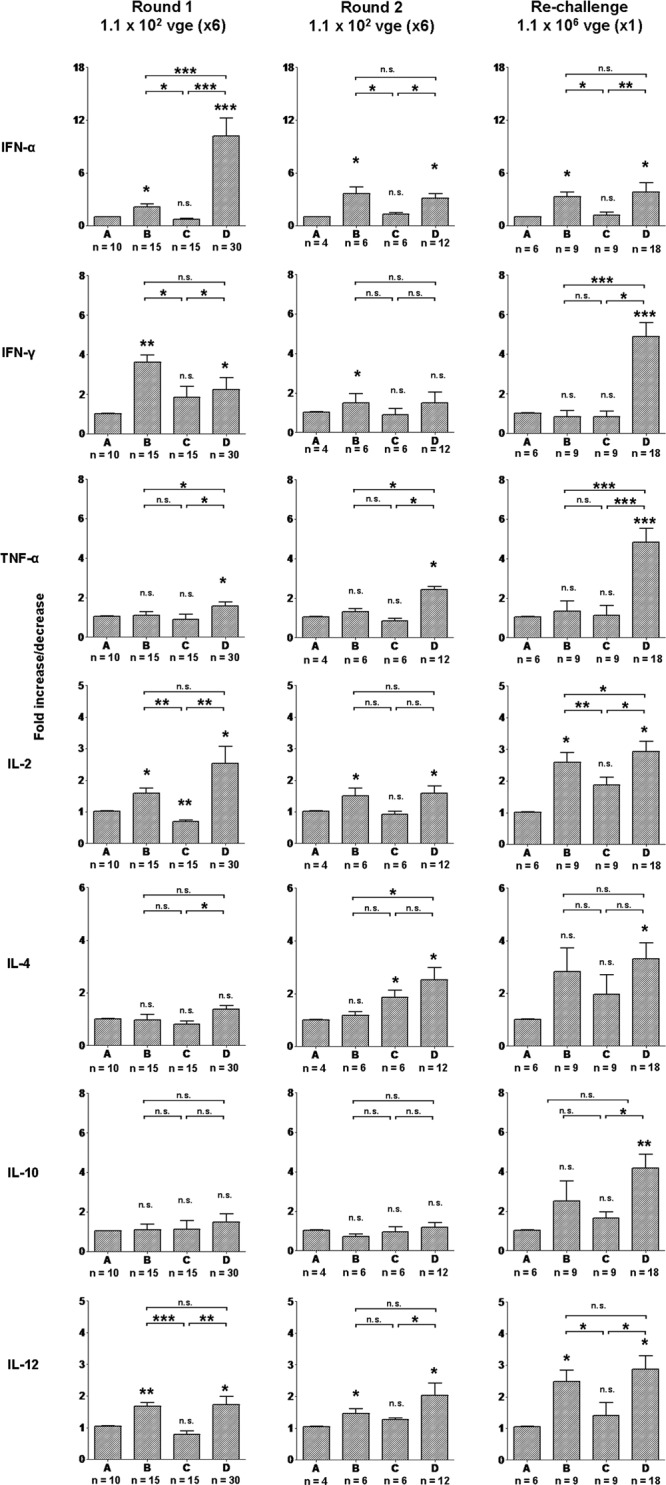
Fig 6.

Quantitative analysis of cytokine gene expression in circulating lymphoid cells in woodchucks injected with two rounds of multiple liver-nonpathogenic doses of WHV and then with a single liver-pathogenic dose of the same virus. The expression of IFN-α, IFN-γ, TNF-α, IL-2, IL-4, IL-10, and IL-12 was analyzed in freshly isolated, nonstimulated PBMCs collected from woodchucks injected with 6 doses of 1.1 × 10² virions each (n = 4), challenged with another six 1.1 × 10²-virion doses (n = 4), and rechallenged with 1.1 × 10⁶ virions (n = 2) of the same WHV inoculum. After each primary or subsequent exposure to WHV, the timeline of infection was divided into four phases (phases A, B, C, and D) according to the distinct profiles of WHV-specific and mitogen-induced T cell responses as described in Results and reported previously (11, 37). The number (n) under each bar shows the number of PBMC samples examined. The level of expression of each cytokine was normalized against the level of β-actin and then compared with the level found prior to primary infection (phase A) to calculate the increase or decrease in expression. The P values above each bar represented by asterisks were obtained by comparing the mean expression level of a given gene during phase B, C, or D, with the mean level of expression determined for the gene in phase A, while the P values shown at the top of each panel were obtained by comparing each mean expression level of a given gene determined for phases B, C, and D. Values marked with one asterisk were significantly different at a P value of ≤0.05, values with two asterisks were significantly different at a P value of ≤0.005, and values with three asterisks were significantly different at a P value of ≤0.0001. n.s., not significantly different.
