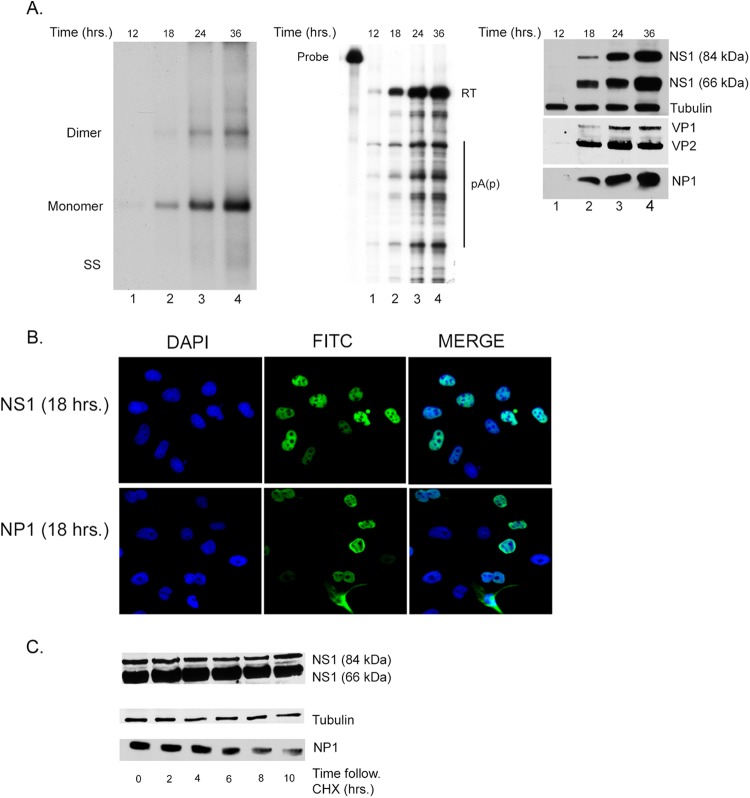
Fig 1.
Characterization of the kinetics of single-cycle MVC infection in parasynchronized permissive WRD cells. (A, left) DNA replication. Southern blot analysis of samples taken from MVC-infected WRD cells in the presence of a neutralizing antibody as described in the text. Representative samples were taken at 12, 18, 24, or 36 h following infection, as shown in lanes 1, 2, 3, and 4, respectively. Viral DNA replication is evidenced by the presence of monomer and dimer replication intermediates. Identification of single-stranded DNA (SS) is also indicated but is underrepresented in this experiment. (Middle) RNA expression. RNase protection assay (RPA) showing RNA expression from the same single-cycle MVC infection shown in panel A. The (pA)p probe used to detect RNA expression is depicted in Fig. 3A. The relative size of the probe is shown on the left, and RNA transcripts are seen in lanes 1 to 4. Read-through transcripts that polyadenylate at the distal polyadenylation site (pA)d are indicated by RT. Transcripts that are polyadenylated at the proximal site are indicated as (pA)p. A full transcription map generated previously (5), updated as described below, is shown in Fig. 3A. (Right) Expression of NS1, NP1, and capsid proteins. Immunoblots of cell extracts from a time course of single-cycle MVC infection probed with anti-NS1, anti-NP1, or anti-capsid antibodies as described in Materials and Methods. Cellular tubulin was used as a loading control. (B) Localization of NS1 and NP1 proteins. Cellular localization of NS1 (top) and NP1 (lower) proteins using specific antibodies as described in Materials and Methods. DAPI was used as a nuclear counterstain. (C) Stability of NS1 and NP1 proteins. Immunoblots of extracts harvested at 0, 2, 4, 6, 8, and 10 h following cycloheximide treatment of MVC-infected WRD cells. The relative levels of the two forms of the NS1 protein, approximately 84 kDa and 66 kDa, are shown in the top panel. The expression of NP is shown in the lower panel, and cellular tubulin is shown as a control for the amount of protein loaded per lane.

