Fig 3.
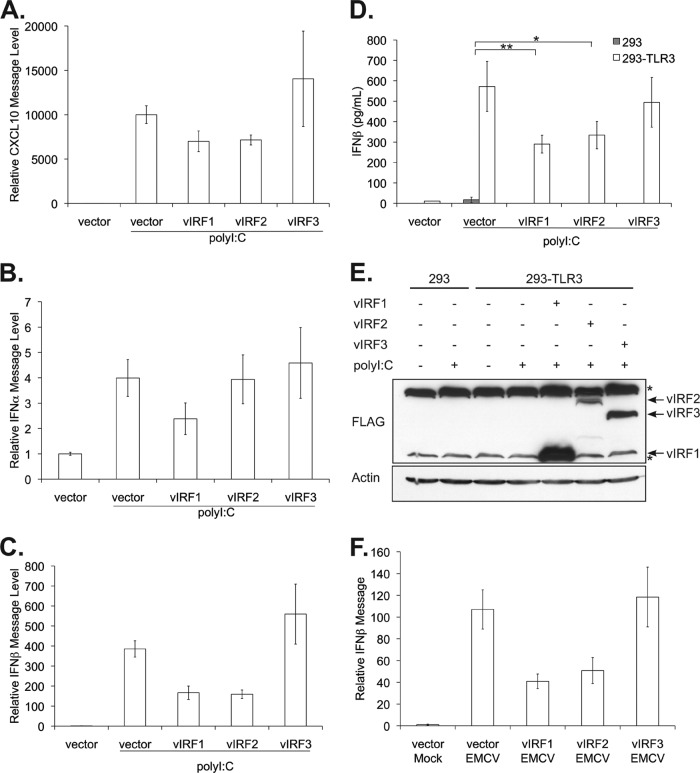
vIRF1 and vIRF2 block TLR3-mediated transcription and production of IFN-β. 293-TLR3 cells were transfected with the control vector or vectors expressing vIRF1, -2, or -3. Twenty-four hours posttransfection, cells were treated with poly(I·C) for 14 h, and cells were harvested for analysis by quantitative RT-PCR. Relative CXCL10 (A), IFN-α (B), and IFN-β (C) message levels were normalized to that of β-actin and represented as fold increases over those of untreated cells. (D and E) Cells were transfected with pcDNA3 vIRF-FLAG constructs or empty pcDNA3 vector as the control. Twenty-four hours posttransfection, cells were treated with poly(I·C), and cells and supernatants were harvested 24 h later. (D) Supernatants were quantitated for secreted IFN-β levels by ELISA. (E) Lysed cells were subjected to SDS-PAGE and immunoblotted with anti-FLAG to determine expression levels of vIRFs posttransfection. The asterisks denote nonspecific bands. (F) 293-TLR3 cells were transfected with control vector or vIRF1, -2, or -3. One day posttransfection, cells were infected with EMCV at an MOI of 0.1 for 24 h before harvesting. Quantitative RT-PCR was performed on RNA isolated from EMCV-infected cells to assess IFN-β message levels normalized to that of β-actin, represented as fold increase over control vector mock-infected cells. Values represent the means plus or minus the standard deviations of the means from triplicate samples. *, P < 0.03, and **, P < 0.02 (by Student's t test).

